- ImageCLEF 2025
- LifeCLEF 2025
- ImageCLEF 2024
- LifeCLEF 2024
- ImageCLEF 2023
- LifeCLEF 2023
- ImageCLEF 2022
- LifeCLEF2022
- ImageCLEF 2021
- LifeCLEF 2021
- ImageCLEF 2020
- LifeCLEF 2020
- ImageCLEF 2019
- LifeCLEF 2019
- ImageCLEF 2018
- LifeCLEF 2018
- ImageCLEF 2017
- LifeCLEF2017
- ImageCLEF 2016
- LifeCLEF 2016
- ImageCLEF 2015
- LifeCLEF 2015
- ImageCLEF 2014
- LifeCLEF 2014
- ImageCLEF 2013
- ImageCLEF 2012
- ImageCLEF 2011
- ImageCLEF 2010
- ImageCLEF 2009
- ImageCLEF 2008
- ImageCLEF 2007
- ImageCLEF 2006
- ImageCLEF 2005
- ImageCLEF 2004
- ImageCLEF 2003
- Publications
- Old resources
You are here
LifeCLEF 2015 Plant task

| News |
| A direct link to the overview of the task: LifeCLEF Plant Identification Task 2015, Hervé Goëau, Pierre Bonnet, Alexis Joly, CLEF 2015 working notes, Toulouse, France |
| Dataset: A public package containing the training set and the test set is now available (including the ground truth, a script to compute scores, the working notes and additional informations). The entire data is under Creative Common license. |
Context
If agricultural development is to be successful and biodiversity is to be conserved, then accurate knowledge of the identity, geographic distribution and uses of plants is essential. Unfortunately, such basic information is often only partially available for professional stakeholders, teachers, scientists and citizens, and often incomplete for ecosystems that possess the highest plant diversity. So that simply identifying plant species is usually a very difficult task, even for professionals (such as farmers or wood exploiters) or for the botanists themselves. Using image retrieval technologies is nowadays considered by botanists as a promising direction in reducing this taxonomic gap. Evaluating recent advances of the IR community on this challenging task might therefore have a strong impact. The organization of this task is funded by the French project Pl@ntNet (INRIA, CIRAD, Telabotanica) and the French CNRS program MASTODONS.
![]()

Task Overview
Following the success of the four previous plant identification tasks (ImageCLEF 2011-13 ; LifeCLEF 2014), we are glad to organize this year a new challenge dedicated to botanical data. The task will be focused on tree, herbs and ferns species identification based on different types of images. Its main novelties compared to the last years will by :
-"use of external resources" : it will be possible to use more external online resources (but strictly forbidden to used data from Tela Botanica website), as training data to enrich the provided one,
- "species number" : the number of species (about 1 000 species), which is an important step towards covering the entire flora of a given region.
Multi-image query
The motivation of the task is to fit better with a real scenario where one user tries to identify a plant by observing its different organs, such as it has been demonstrated in [MAED2012]. Indeed, botanists usually observe simultaneously several organs like the leaves and the fruits or the flowers in order to disambiguate species which could be confused if only one organ were observed. Moreover, if only one organ is observed, such as the bark of a deciduous plant during winter where nothing else is observable, then the observation of this organ with several photos related to different point of views could be more informative than only one point of view.
Thus, contrary to the 3 first years, the species identification task won't be image-centered but OBSERVATION-centered. The aim of the task is be to produce a list of relevant species for each observation of a plant of the test dataset, i.e. one or a set of several pictures related to a same event: one same person photographing several detailed views on various organs the same day with the same device with the same lightening conditions observing one same plant.
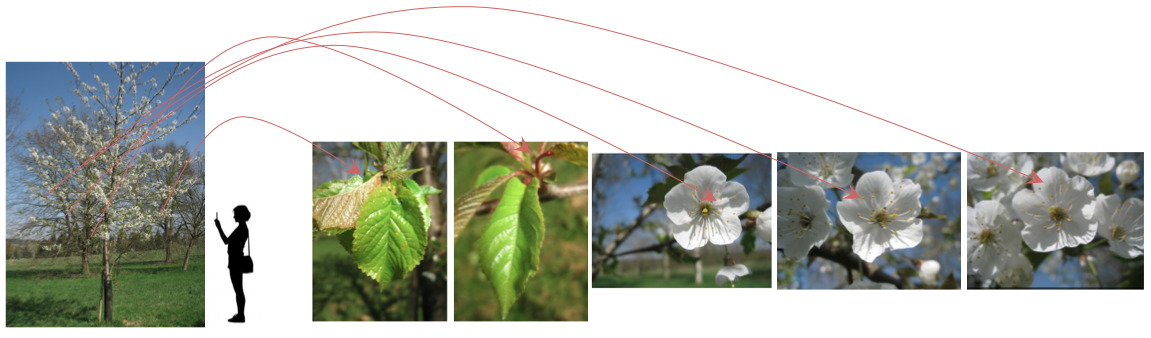
One observation of one individual-plant observed the same day by a same author involving several pictures with the same Observation ID. If this observation is in the test dataset, participants of the task will have to produce a list of relevant species according to the set of the 6 pictures.
User ratings on image quality
The training and test data are composed of images collected through a citizen sciences initiative that was initiated 5 years ago in collaboration with Tela Botanica (social network of amateur and expert botanists). This makes the task closer to the conditions of a real-world application: (i) images of the same species are coming from distinct plants living in distinct areas (ii) pictures are taken by different users that might not used the same protocol to acquire the images (iii) pictures are taken at different periods in the year. Additional information include contextual meta-data (author, date, locality name) and some EXIF data. Novelty of the last year (vote annotation for most of the pictures), will be conserve this year. These annotations are collectively produced by the Tela Botanica members through a collaborative web tool called pictoflora released two year ago now.
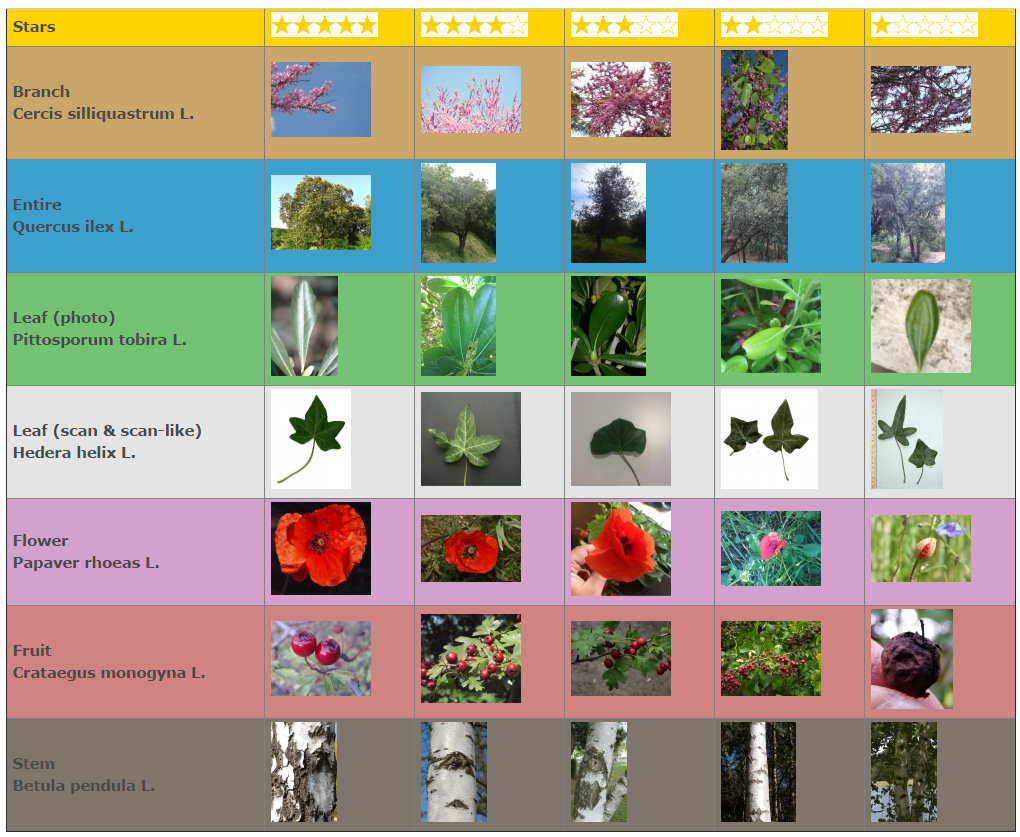
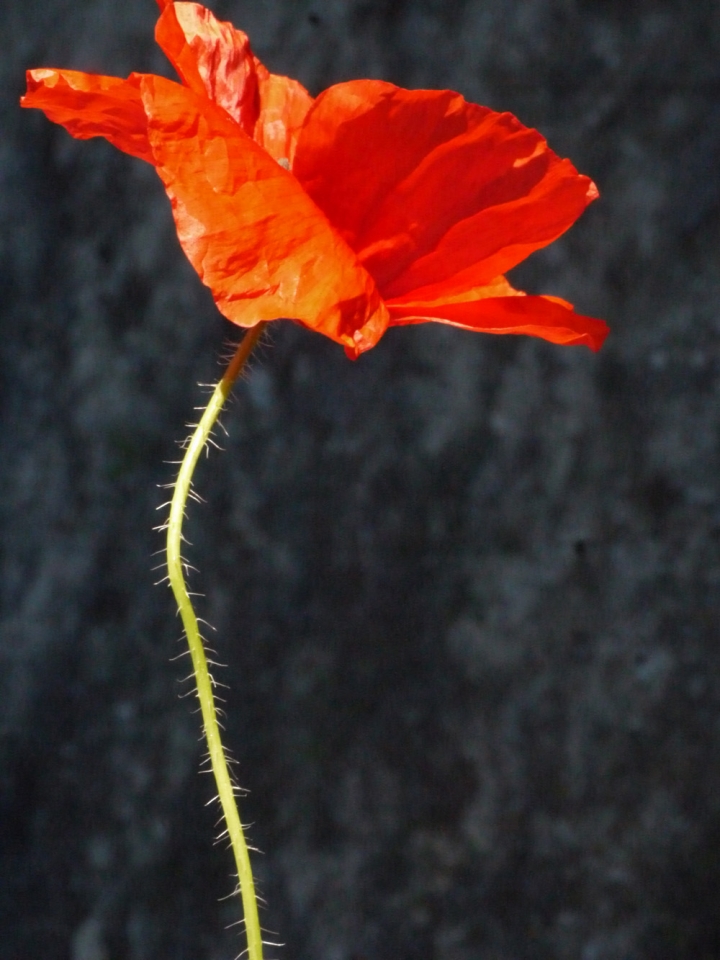
The following table gives some examples of pictures with the average of the user ratings on image quality, and illustrates at the same time the different types of views (the "LeafScan" views, the photographs of "Leaf", "Flower", "Fruit", "Stem", "Entire", and the new view called "Branch"). More the value is close to 5, more the organ is well photographed, typically a close-up photo where the organ covers a wide surface of the picture, sharp while the background is optically blurred thanks to a short deep-of-field, and thus with a clear and useful visual content for helping the plant identification. At the opposite, more the value is close to 1, less the picture is helpful for identifying the species for various reasons: the picture is globally blurred or the organ is out of focus, the organ is to small or/and the background is predominant with a sharp visual content like grass or leafage of other plants, the organ is too damaged like old fruit or dry leaves, some external object like a ruler, a pen or a coin for giving some information on size, etc.
Participants will be free to exploit or not all the pictures of the training dataset according to these user rating informations.
 |
All the dataset is built and produced collaboratively by the Tela Botanica members: the quality votes, but also the view tags on each pictures, and the taxonomical names associated to the observations through a second online tool called Identiplante. It means that the annotations, the rates and the species names are revised and slightly improved days by days, but some errors can occur in the dataset.
Dataset
The task will be based on the Pl@ntView dataset which focuses on 1 000 herb, tree and fern species centered on France (some plants observations are from neighboring countries). It contains 113,205 pictures belonging each to one of the 7 types of view reported into the meta-data, in a xml file (one per image) with explicit tags.
To sum up each image is associated with the following meta-data:
- ObservationId: the plant observation ID from which several pictures can be associated
- FileName
- MediaId
- View Content: Branch, Entire, Flower, Fruit, Leaf, LeafScan, Stem
- ClassId: the class number ID that must be used as ground-truth. It is a numerical taxonomical number used by Tela Botanica
- Species the species names (containing 3 parts: the Genus name, the Species name, the author(s) who discovered or revised the name of the species)
- Genus: the name of the Genus, one level above the Species in the taxonomical hierarchy used by Tela Botanica
- Family: the name of the Family, two levels above the Species in the taxonomical hierarchy used by Tela Botanica
- Date: (if available) the date when the plant was observed,
- Vote: the (round up) average of the user ratings on image quality
- Locality: (if available) locality name, most of the time a town
- Latitude & Longitude: (if available) the GPS coordinates of the observation in the EXIF metadata, or, if no GPS information were found in the EXIF, the GPS coordinates of the locality where the plant was observed (only for the towns of metropolitan France)
- Author: name of the author of the picture,
And if the image was included in previous plant task:
- Year: ImageCLEF2011, ImageCLEF2012, ImageCLEF2013, PlantCLEF2014 when the image was integrated in the benchmark
- IndividualPlantId2013: the plant observation ID used last year during the ImageCLEF2013 plant task,
- ImageID2013: the image id.jpg used in 2013.
We provide here a set of 2 files related to one image: the picture and its associated xml file:
- 6.jpg
- 6.xml
Partial meta-data information can be found in the image's EXIF, and might include:
- the camera or the scanner model,
- the image resolutions and the dimensions,
- for photos, the optical parameters, the white balance, the light measures…
All data are published under a creative commons license.
Task description
Goal
The task will be evaluated as a plant species retrieval task based on multi-image plant observations queries. The goal is to retrieve the correct plant species among the top results of a ranked list of species returned by the evaluated system. Contrary to previous plant identification benchmarks, queries are not defined as single images but as plant observations, meaning a set of 1 to 5 images depicting the same individual plant observed by the same person the same day. Each image of a query observation is associated with a single view type (entire plant, branch, leaf, fruit, flower, stem or leaf scan) and with contextual meta-data (data, location, author). Each participating group is allowed to submit up to 4 runs built from different methods. Semi-supervised and interactive approaches, particularly for segmenting leaves from the background, are allowed but will be compared independently from fully automatic methods. Any human assistance in the processing of the test queries has therefore to be signaled in the submitted runs (see next section on how to do that).
Training and test data
A part of PlantCLEF dataset will be provided as training data whereas the remaining part will be used later as test data. Training AND test pictures used during LifeCLEF 2014 Plant Identification Task are mostly part from the dataset and they will be systematically included in the training set. Test observation will be chosen by randomly sampling 1/3 of the observations of each species.
- The training data finally results in 27,907 plant-observations illustrated by 91,759 images (8130 of "Branch", 16235 photographs of "Entire", 28225 of Flower", 7720 "Fruit", 13367 of "Leaf", 5476 "Stem" and 12605 scans and scan-like pictures of leaf) with complete xml files associated to them. The download link of training data is now available through the registration interface.
- The test data results in 13,887 plant-observation-queries illustrated by 21,446 images (2088 of "Branch", 6113 photographs of "Entire", 8327 of Flower", 1423 of "Fruit", 2690 of "Leaf", 584 "Stem" and 221 scans and scan-like pictures of leaf) with purged xml files, i.e without the taxon name (the ground truth), the vernacular name (common name of the plant) and the image quality ratings (that would not be available at query stage in a real-world mobile application).
The queries are expressed in the ObservationId field in the purged xml, but an explicit list of queries can be found here:
to be completed
The link between the queries and the images are expressed with the ObservationId and FileName fields in each purged xml files, but an explicitly map between the test images and the queries can be found here:
to be completed
As a novelty this year, participants are also allowed to use external training data but at the condition that (i) the experiment is entirely re-produceable, i.e. that the used external ressource is clearly referenced and accessible to any other research group in the world, (ii) participants submit at least one run without external training data so that we can study the contribution of such ressources, (iii) the additional ressource does not contain any of the test observations.
Run format
The run file must be named as "teamname_runX.run" where X is the identifier of the run (i.e. 1, 2, 3 or 4). The run file has to contain as much lines as the total number of predictions, with at least one prediction per test observation plant and a maximum of 1 000 predictions per test image (1 000 being the total number of species). Each prediction item (i.e. each line of the run file) has to respect the following format:
<ObservationId;ClassId;rank;score>
The ClassId is the main taxonomical number in an official french taxonomical referential used by Tela Botanica and helping botanists to deal with synonymy. <rank> is the ranking of a given species for a given test ObservationId. <Score> is a confidence score of a prediction item (the lower the score the lower the confidence). Here is a short fake run example respecting this format on only 8 test observations:
myteam_run3.txt
The order of the prediction items (i.e. the lines of the run file) has no influence on the evaluation metric, so that contrary to our example prediction items might be sorted in any way. On the other side, the <rank> field is the most important one since it will be used as the main key to sort species and compute the final metric.
For each submitted run, please give in the submission system a description of the run. A combobox will specify whether the run was performed fully automatically or with a human assistance in the processing of the queries. Then, a textarea should contain a short description of the used method, particularly for helping differentiating the different runs submitted by the same group, for instance:
selecting only pictures with a vote >1 in the training dataset, and for each image of the test observation plant: matching-based method using SIFT features, RANSAC algorithm and K-NN classifier with K=20 in order to produce a probability distribution. Then bayesian rule for combining the probabilities for producing a species list following a decreasing order of final probabilities
Optionally, you can add one or several bibtex reference(s) to publication(s) describing the method more in details.
For each submitted run, it will be asked (optional but highly recommended) to produce a second run file detailing species prediction at image level like previous years, before the combination of multiple-image of the observation query. This complementary run file must be named as "teamname_runX_image.run" where X is the identifier of the run (i.e. 1,2 or 3). The run file has to contain as much lines as the total number of predictions, with at least one prediction per test image and a maximum of 1 000 predictions per test image (1 000 being the total number of species). Each prediction item (i.e. each line of the file) has to respect the following format :
<test_image_name.jpg;ClassId;rank;score>
Here is a fake run example respecting this format:
myteam_run3_image.txt
This optional file will be very useful in order to analysis how much the combination of pictures from a same plant contribute to the final contribution comparing a single image species prediction. Moreover, it will enable to produce detailed scores by type of view like the three previous years.
Metrics
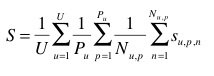
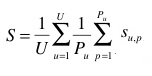
The primary metric used to evaluate the submitted runs will be a score related to the rank of the correct species in the list of retrieved species. Each plant observation test will be attributed with a score between 0 and 1: of 1 if the 1st returned species is correct and will decrease quickly while the rank of the correct species increases. An average score will then be computed on all test individual plant. A simple mean on all plant observation test would however introduce some bias. Indeed, we remind that the PlantCLEF dataset was built in a collaborative manner. So that few contributors might have provided much more observations and pictures than many other contributors who provided few. Since we want to evaluate the ability of a system to provide correct answers to all users, we rather measure the mean of the average classification rate per author. Finally, our primary metric is defined as the following average classification score S:

U : number of users (who have at least one image in the test data)
Pu : number of individual plants observed by the u-th user
Su,p : score between 1 and 0 equals to the inverse of the rank of the correct species (for the p-th plant observed by the u-th user)
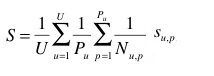
A secondary metric will be used to evaluate the complementary submitted runs providing species determinations at the image level. Each test image will be attributed with a score between 0 and 1 : of 1 if the 1st returned species is correct and will decrease quickly while the rank of the correct species increases. An average score will then be computed on all test images. Following the same motivations express above, a simple mean on all test images would however introduce some bias. Some authors sometimes provided many pictures of the same individual plant (to enrich training data with less efforts). Since we want to evaluate the ability of a system to provide the correct answer based on a single plant observation, we also have to average the classification rate on each individual plant. Finally, our secondary metric is defined as the following average classification score S:
U : number of users (who have at least one image in the test data)
Pu : number of individual plants observed by the u-th user
Nu,p : number of pictures taken from the p-th plant observed by the u-th user
Su,p,n : score between 1 and 0 equals to the inverse of the rank of the correct species (for the n-th picture taken from the p-th plant observed by the u-th user)
Frequently asked questions
In the "test" dataset there are associated xml files where "Content" attributes are indicated. Are we allowed to use this information during the prediction task or would it be considered as a manual intervention on the process.
- Yes, you are allowed to use this information during the prediction (like in the two previous years). We consider that species identification is a very challenging task and we don't want to add more difficulties with an organ/view prediction step.
Results
The task overview working note summarizing the results of the whole task is available HERE (pdf). Individual working notes of the participants can be found within CLEF 2015 CEUR-WS proceedings.
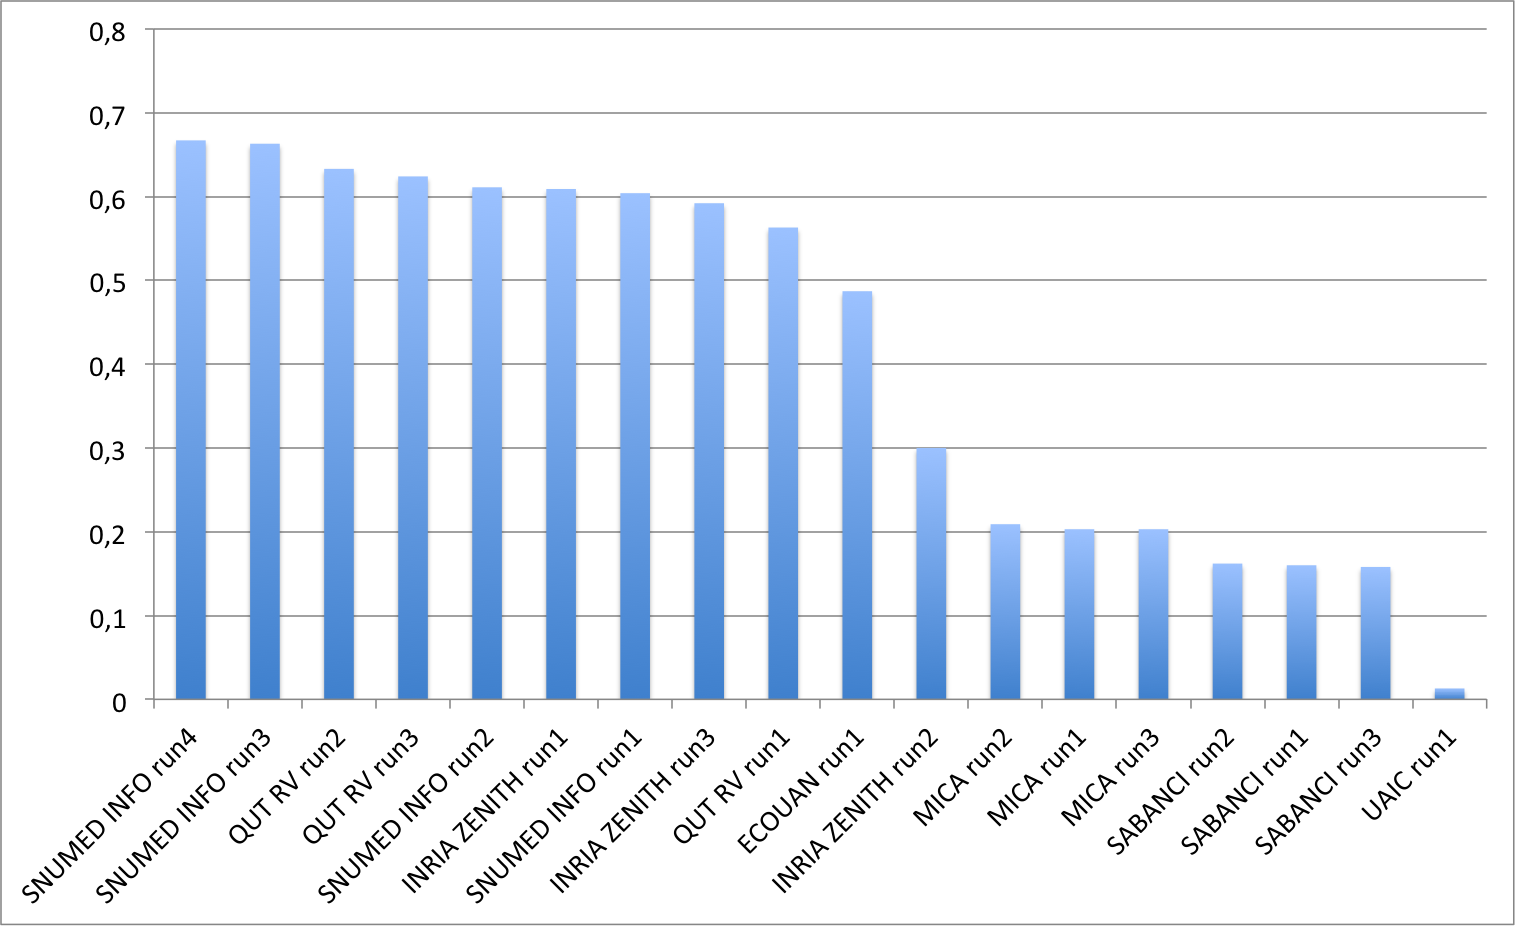
A total of 7 participating groups submitted 19 official runs and 14 complementary runs on images. Thanks to all of them for their efforts.
The following graphic and table show the scores obtained on the main task on multi-image plant observation queries.

<
| Run | filename | Score |
|---|---|---|
| SNUMED INFO run4 | SNUMedinfo_run4 | 0,667 |
| SNUMED INFO run3 | SNUMedinfo_run3 | 0,663 |
| QUT RV run2 | subset_run2 | 0,633 |
| QUT RV run3 | subset_run3 | 0,624 |
| SNUMED INFO run2 | SNUMedinfo_run2 | 0,611 |
| INRIA ZENITH run1 | zenith-run1-CNN-max | 0,609 |
| SNUMED INFO run1 | SNUMedinfo_run1 | 0,604 |
| INRIA ZENITH run3 | zenith-run3-fusion-all-maximilien | 0,592 |
| QUT RV run1 | subset_run1 | 0,563 |
| ECOUAN run1 | ecouan_run1 | 0,487 |
| INRIA ZENITH run2 | zenith-run2-fisher-log-reg-borda | 0,300 |
| MICA run2 | mica_run2 | 0,209 |
| MICA run1 | mica_run1 | 0,203 |
| MICA run3 | mica_run3 | 0,203 |
| SABANCI run2 | Sabanci_Okan_run2 | 0,162 |
| SABANCI run1 | Sabanci_Okan_run1 | 0,160 |
| SABANCI run3 | Sabanci-Okan-run3 | 0,158 |
| UAIC run1 | uaic2015_run1 | 0,013 |
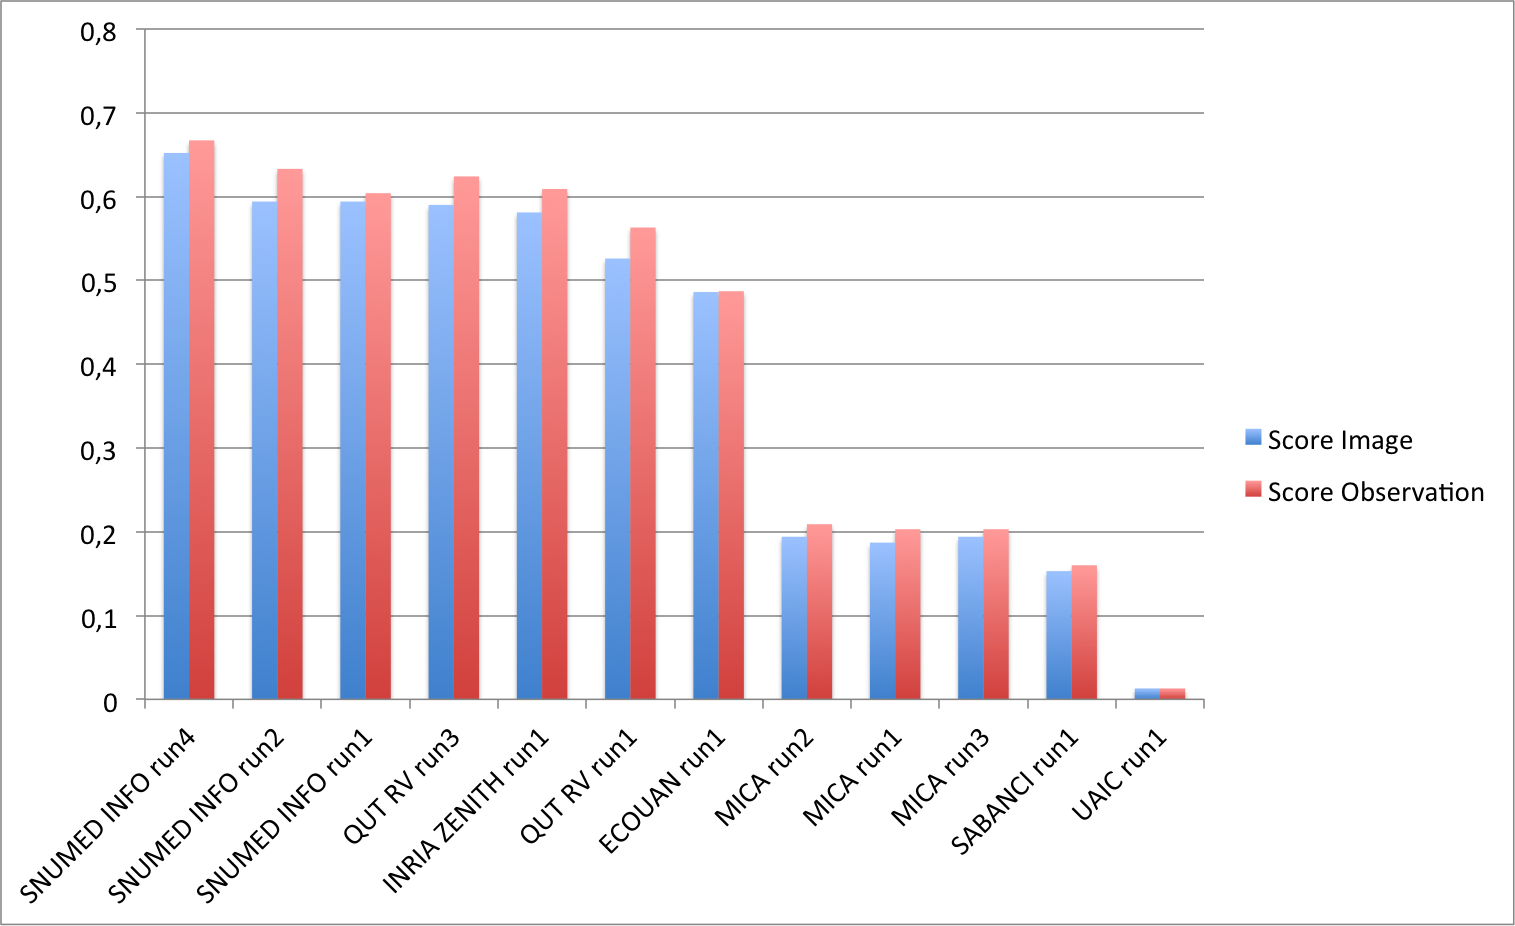
Complementary results on images
The following graphic and table and below present the scores obtained on the complementary run files focusing on images. Thanks to the participants who produced these not mandatory run files. In order to evaluate the benefit of the combination of the test images from the same observation, the graphic compares the pairs of run files on images and on observations assumed to have been produced with the same method.
(Click on the graphic to enlarge it.)

| Run | filename | Score Image | Score Observation |
|---|---|---|---|
| SNUMED INFO run4 | SNUMedinfo_run4_image | 0.652 | 0.667 |
| SNUMED INFO run2 | SNUMedinfo_run2_image | 0.594 | 0.633 |
| SNUMED INFO run1 | SNUMedinfo_run1_image | 0.594 | 0.604 |
| QUT RV run3 | subset_run3_image | 0.590 | 0.624 |
| INRIA ZENITH run1 | zenith-run1-julien-image | 0.581 | 0.609 |
| QUT RV run1 | subset_run1_image | 0.526 | 0.563 |
| ECOUAN run1 | ecouan_run1_image | 0.486 | 0.487 |
| MICA run2 | mica_run2_image | 0.194 | 0.209 |
| MICA run1 | mica_run1_image | 0.187 | 0.203 |
| MICA run3 | mica_run3_image | 0.194 | 0.203 |
| SABANCI run1 | Sabanci_Okan_run1_image | 0.153 | 0.160 |
| UAIC run1 | uaic2015_run1_image | 0.013 | 0.013 |
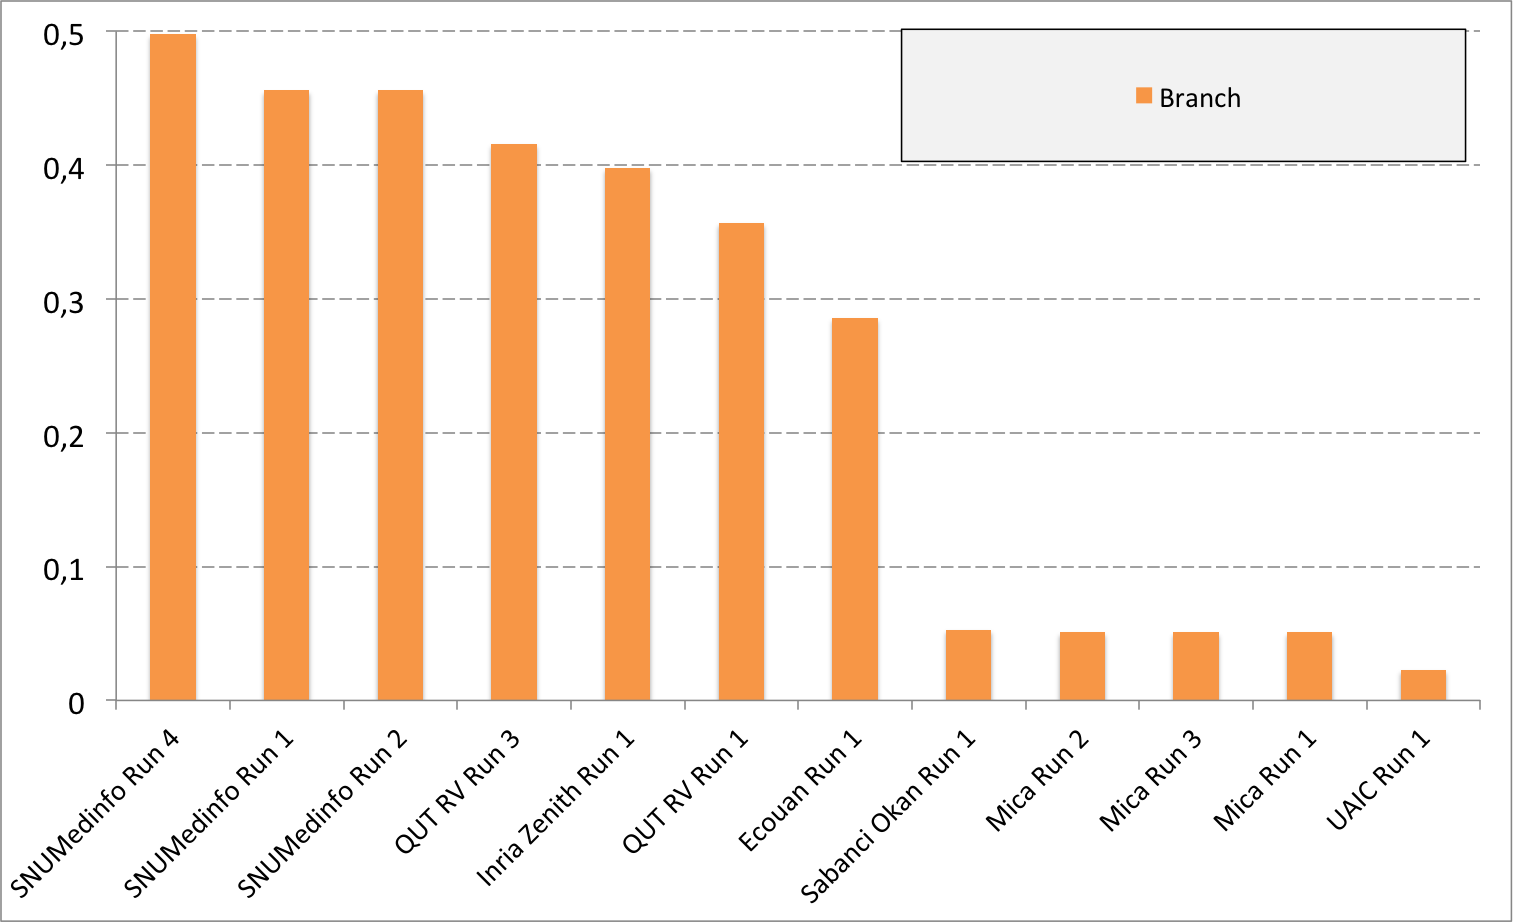
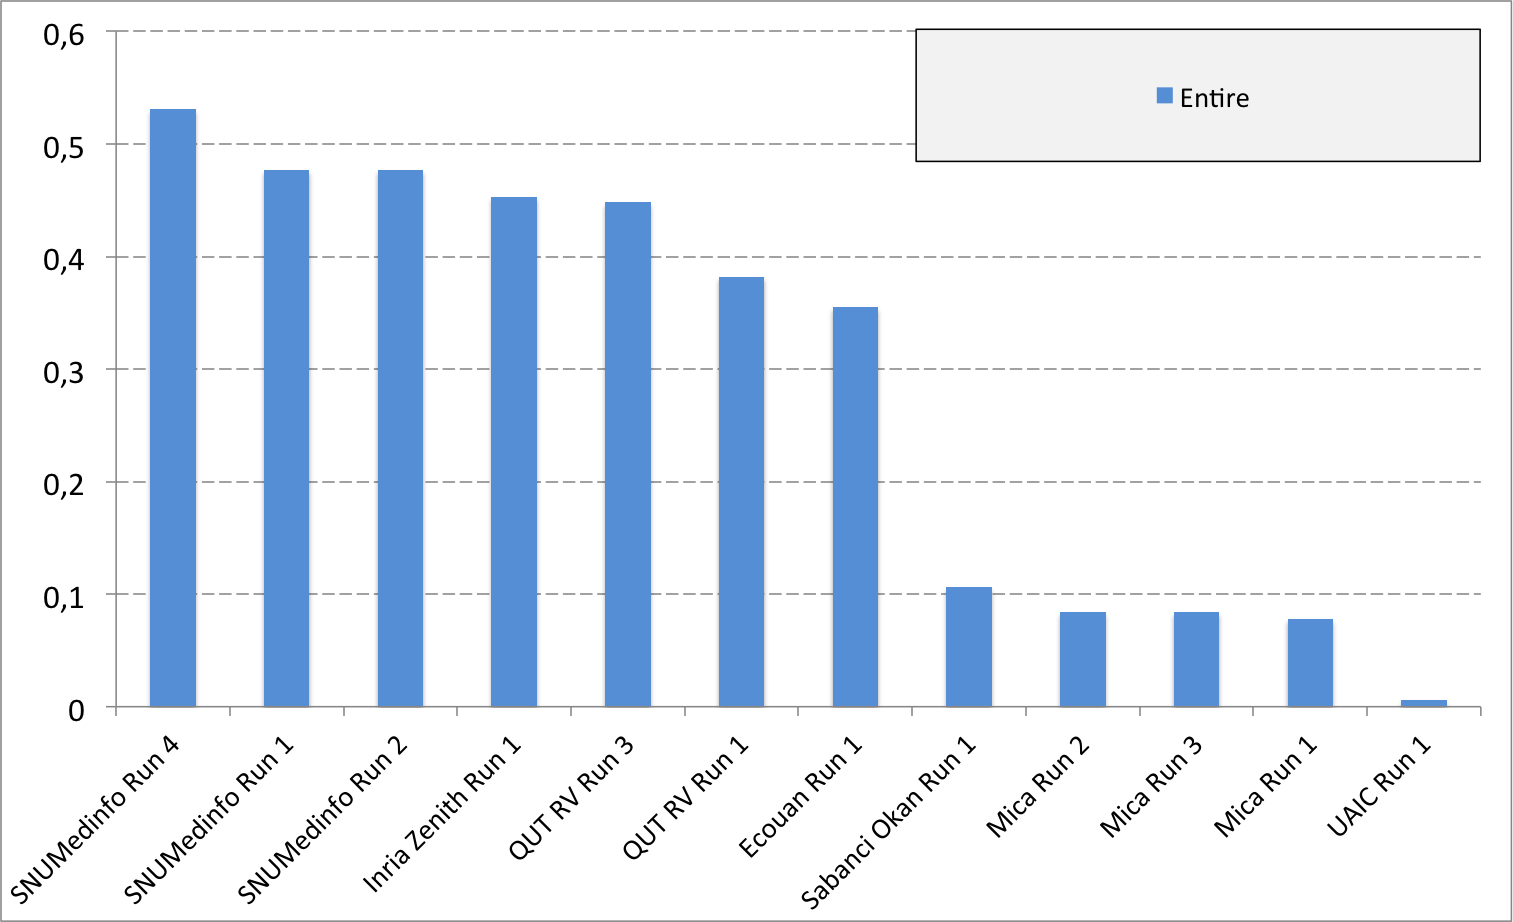
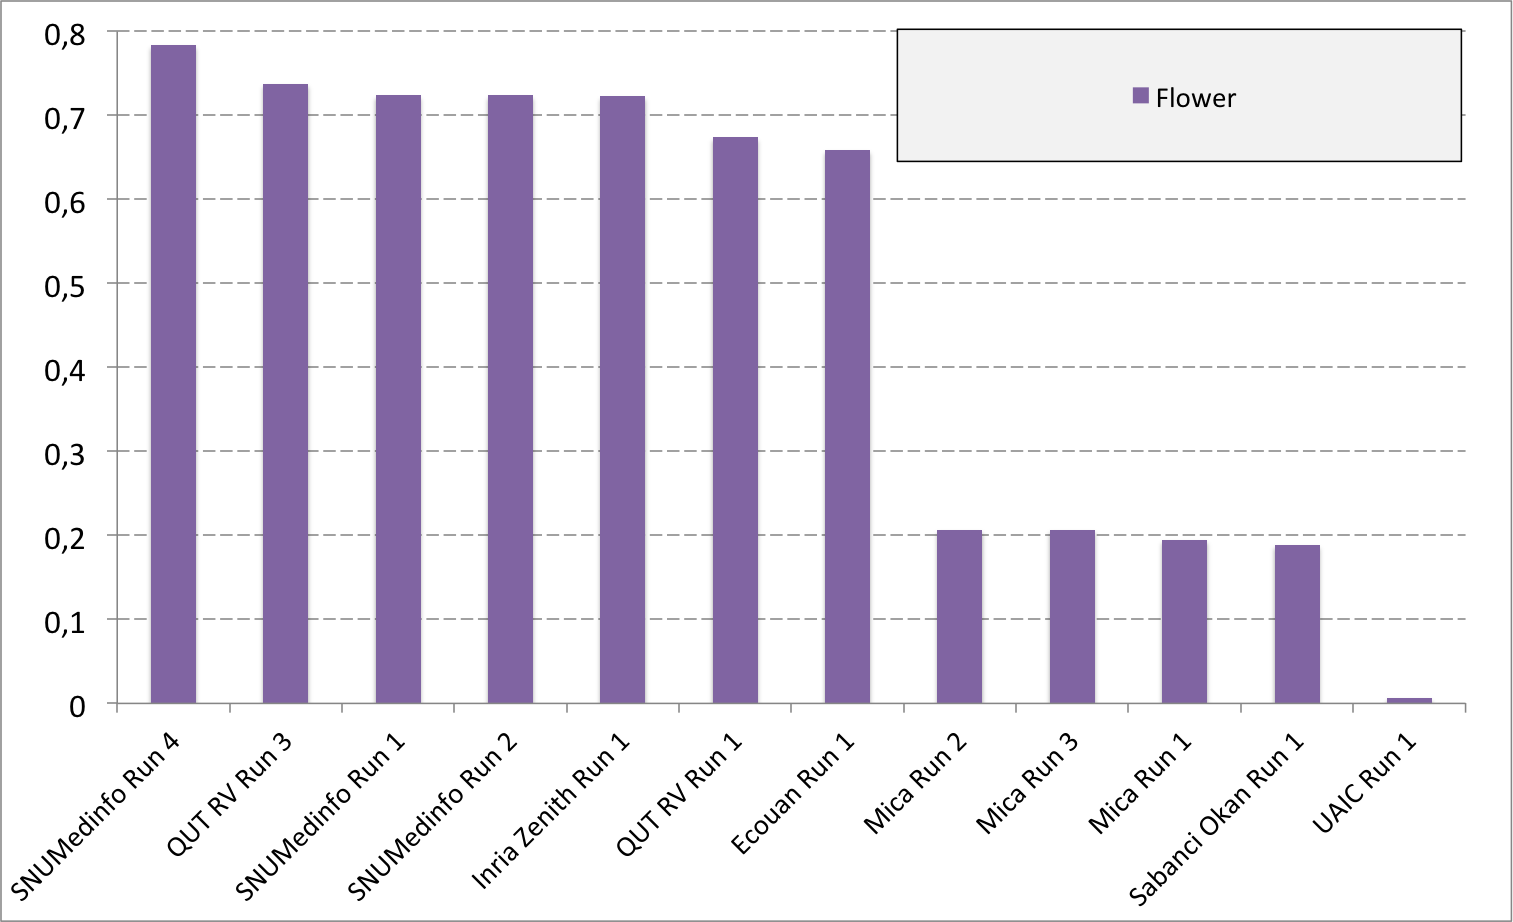
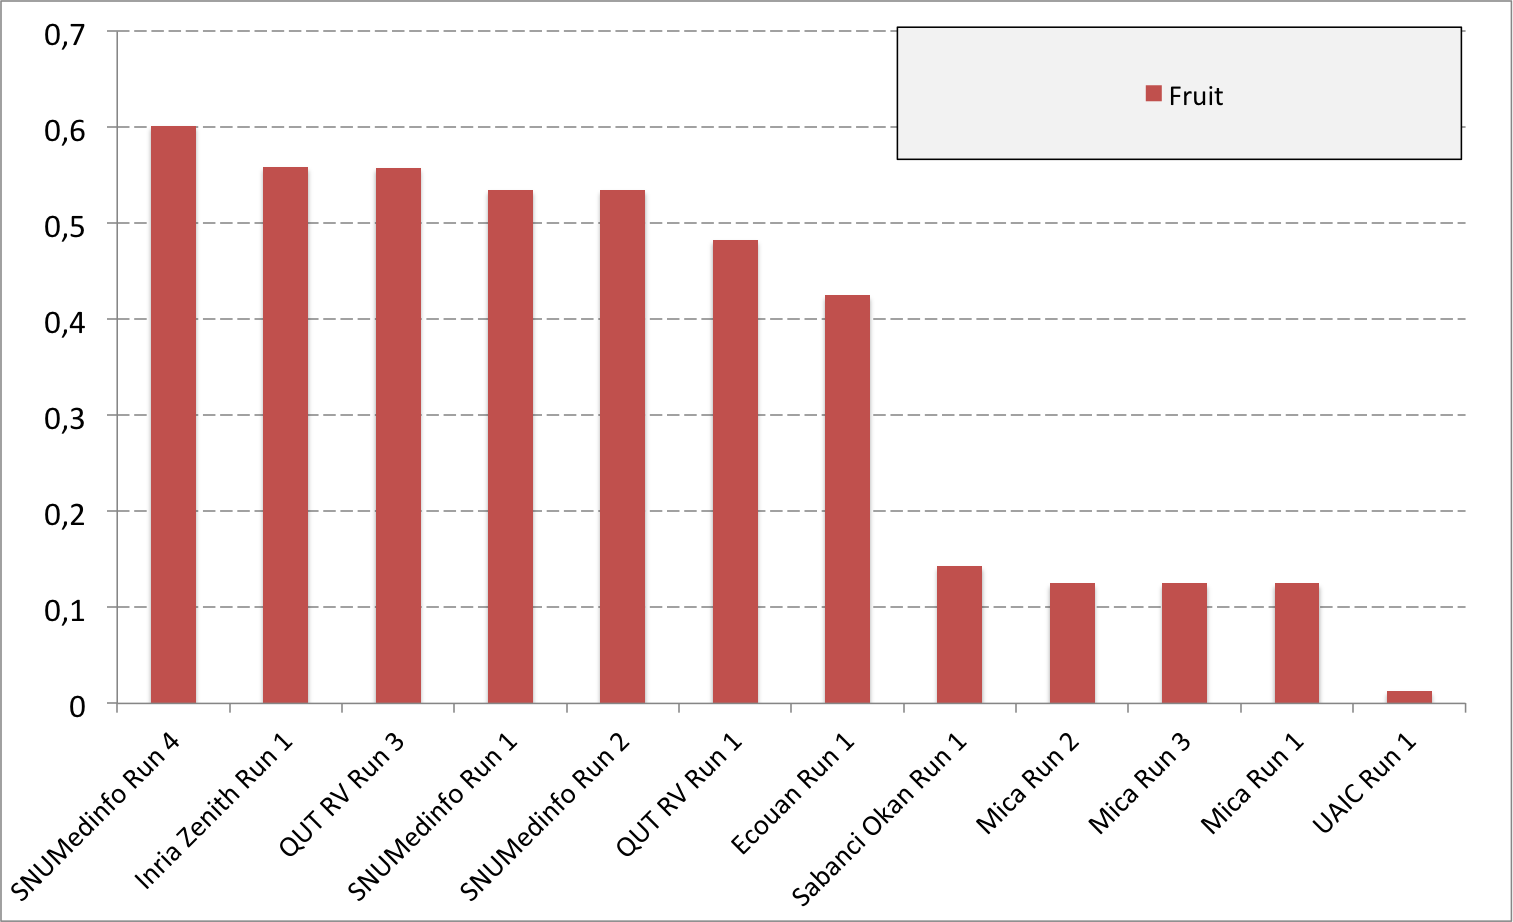
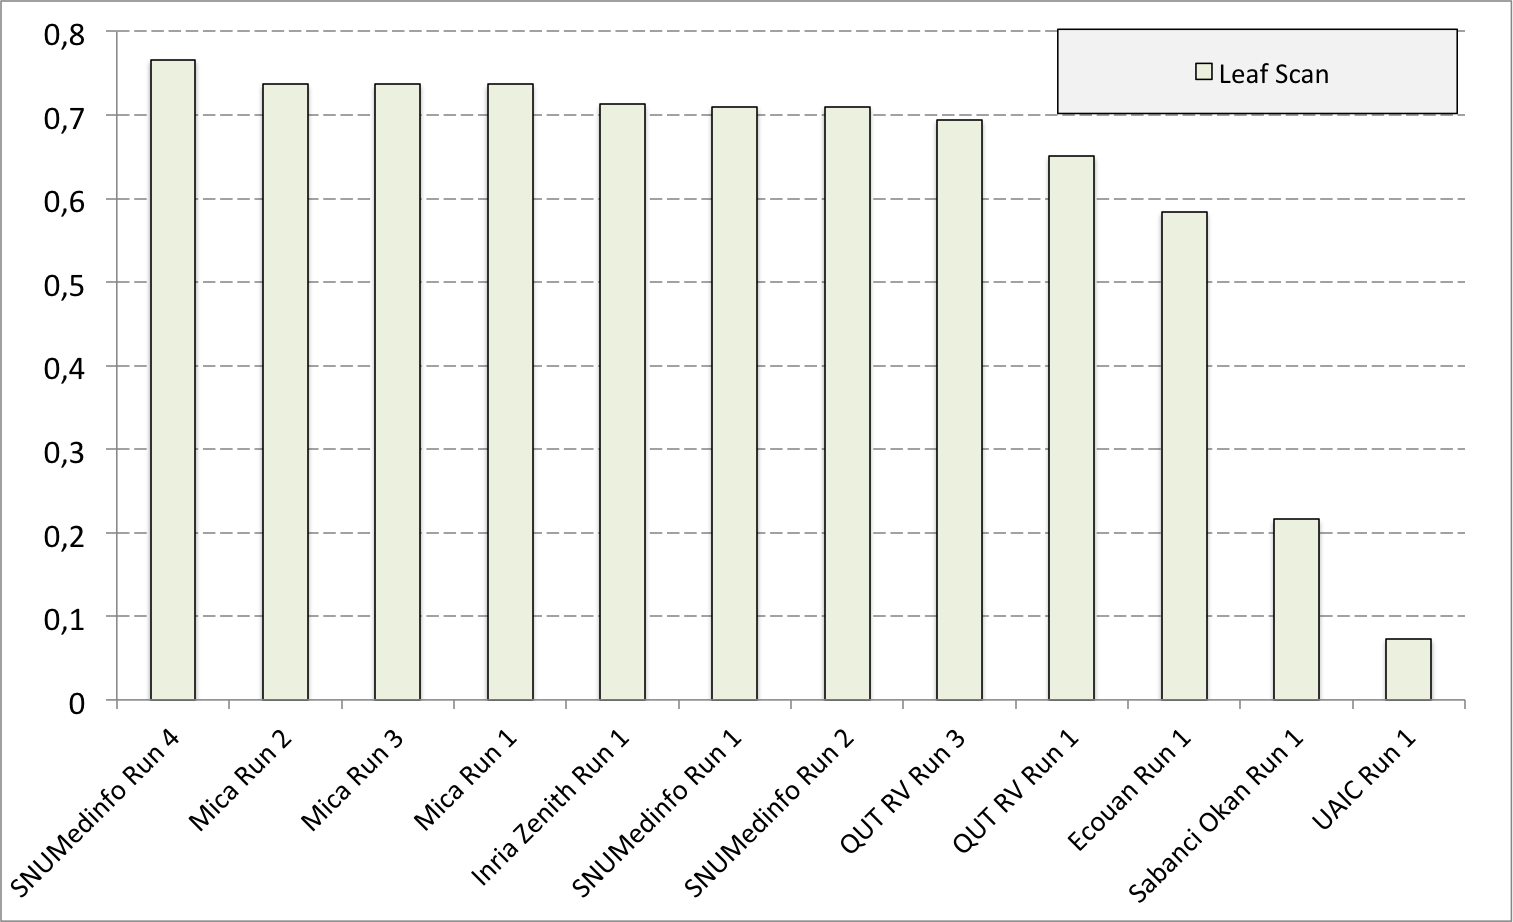
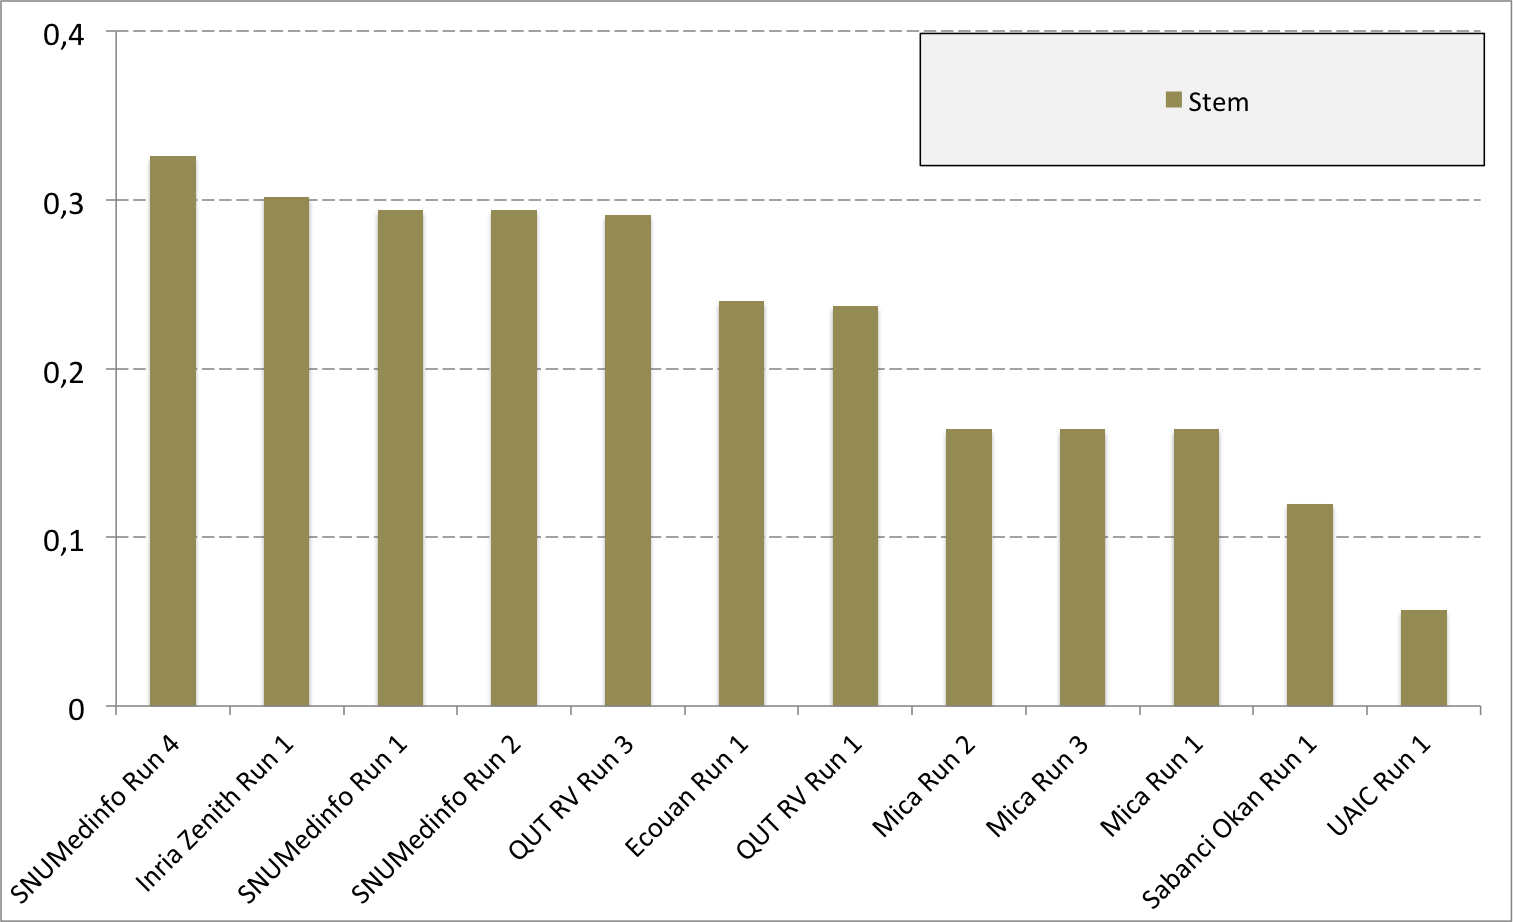
Complementary results on images detailed by organs
The following table and graphics below show the detailed scores obtained for each type of plant organs. Remember that we use a specific metric weighted by authors and plants, and not by sub-categories, explaining why the score on images not detailed is not the mean of the 7 scores of these sub-categories.
(Click on the graphics to enlarge them.)
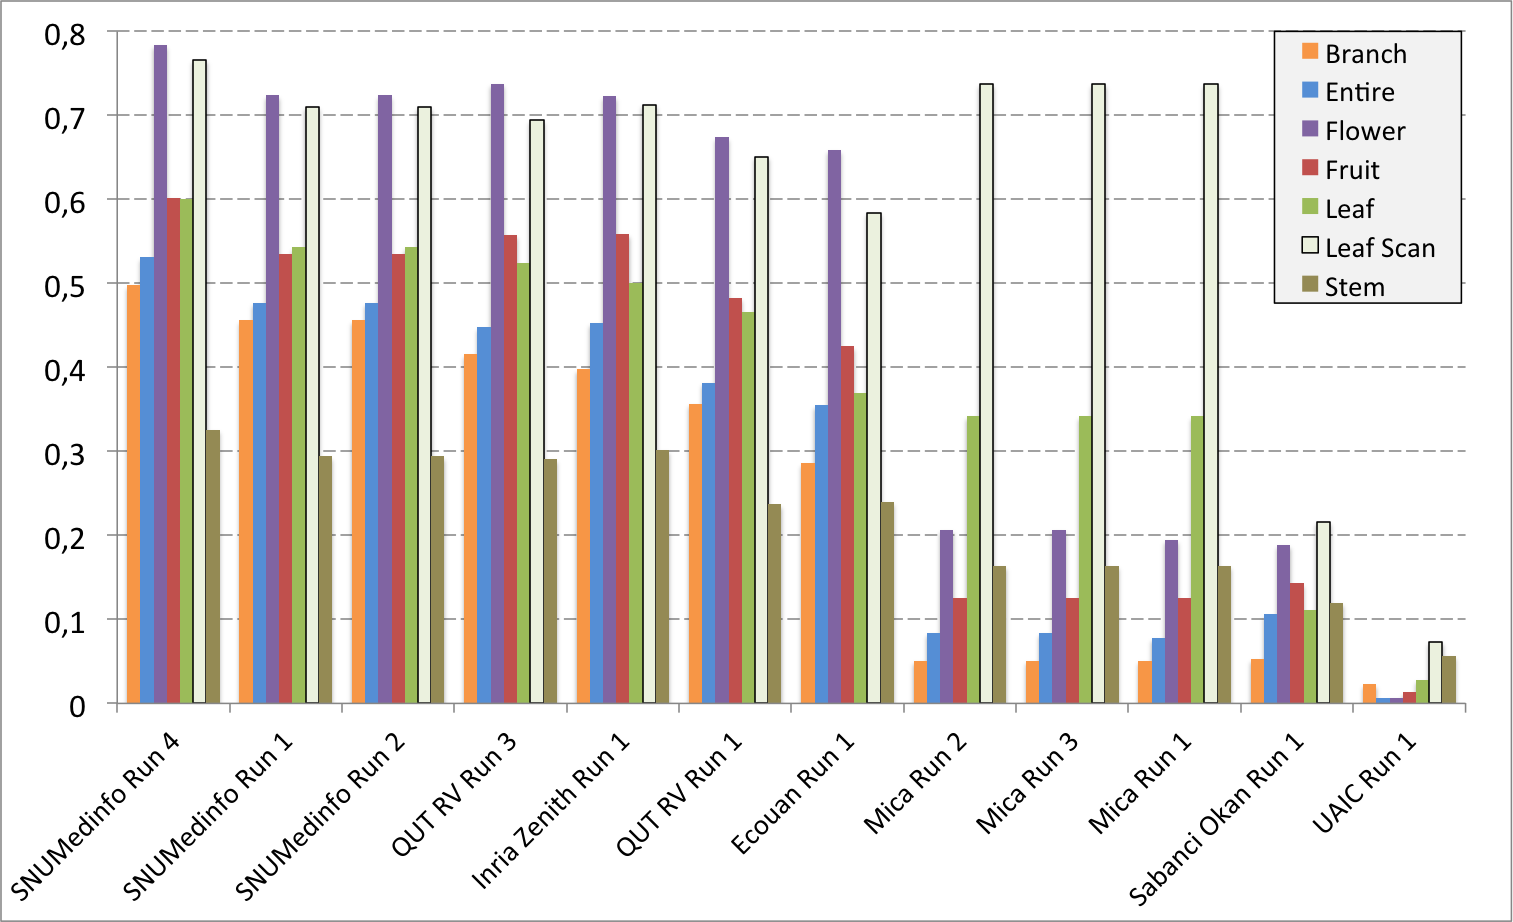


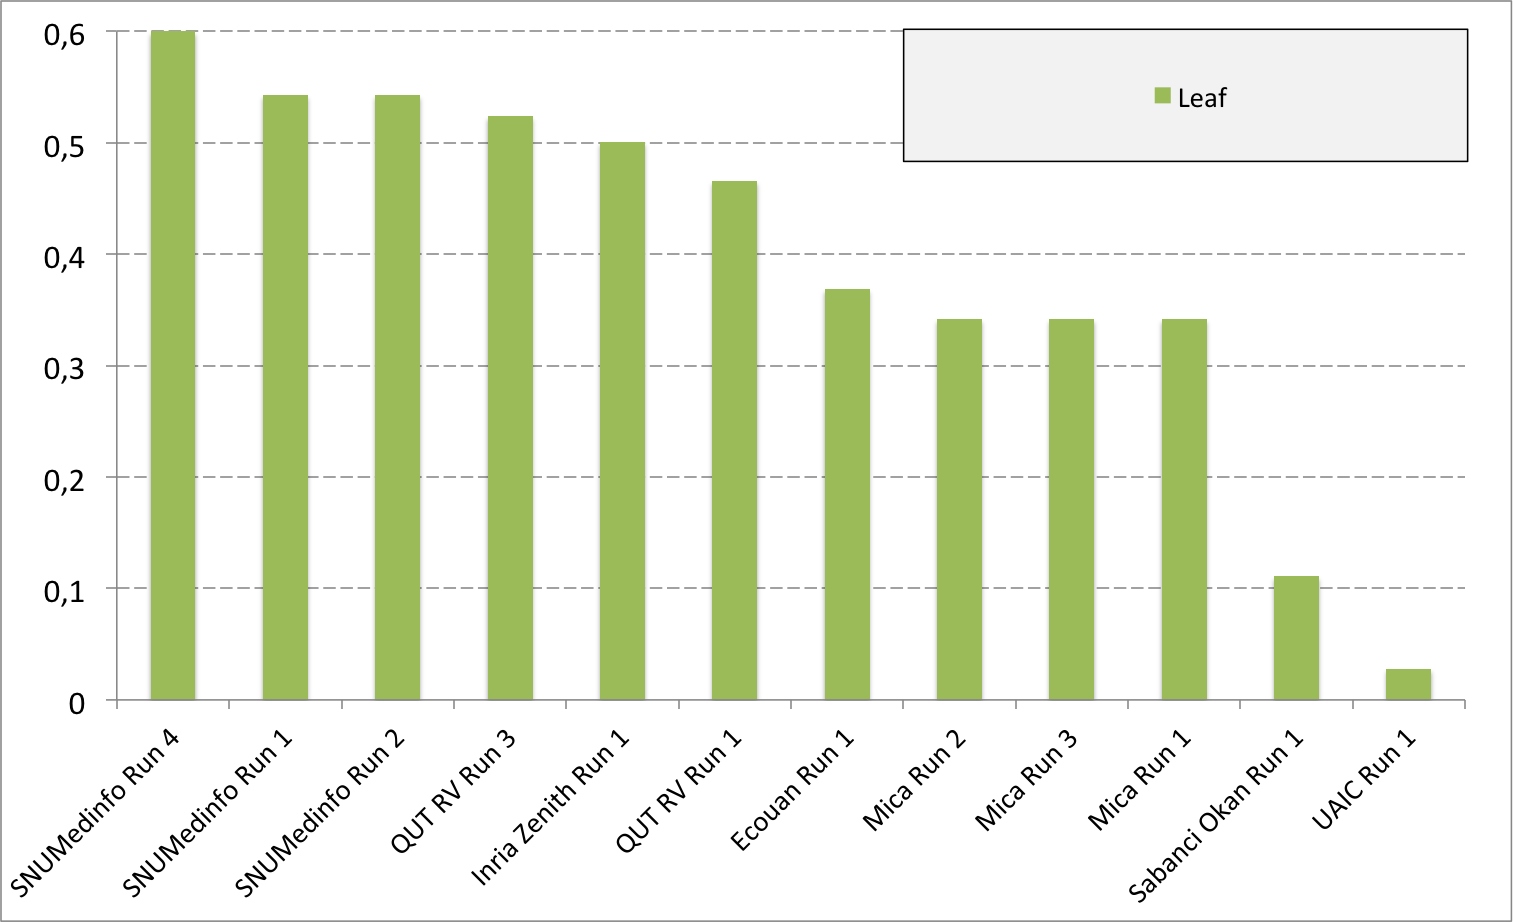


| Run name | Run filename | Branch | Entire | Flower | Fruit | Leaf | Leaf Scan | Stem | Score Image |
|---|---|---|---|---|---|---|---|---|---|
| SNUMedinfo Run 4 | SNUMedinfo_run4_image | 0,498 | 0,531 | 0,784 | 0,602 | 0,6 | 0,766 | 0,326 | 0,652 |
| SNUMedinfo Run 1 | SNUMedinfo_run1_image | 0,456 | 0,477 | 0,724 | 0,535 | 0,543 | 0,71 | 0,294 | 0,594 |
| SNUMedinfo Run 2 | SNUMedinfo_run2_image | 0,456 | 0,477 | 0,724 | 0,535 | 0,543 | 0,71 | 0,294 | 0,594 |
| QUT RV run3 | subset_run3_image | 0,416 | 0,448 | 0,738 | 0,558 | 0,524 | 0,694 | 0,291 | 0,59 |
| Inria Zenith Run 1 | zenith-run1-julien-image | 0,398 | 0,453 | 0,723 | 0,559 | 0,501 | 0,713 | 0,302 | 0,581 |
| QUT RV Run 1 | subset_run1_image | 0,357 | 0,382 | 0,674 | 0,483 | 0,466 | 0,651 | 0,237 | 0,526 |
| Ecouan Run 1 | ecouan_run1_image | 0,286 | 0,355 | 0,659 | 0,425 | 0,369 | 0,584 | 0,24 | 0,486 |
| Mica Run 2 | mica_run2_image | 0,051 | 0,084 | 0,207 | 0,125 | 0,342 | 0,737 | 0,164 | 0,194 |
| Mica Run 3 | mica_run3_image | 0,051 | 0,084 | 0,207 | 0,125 | 0,342 | 0,737 | 0,164 | 0,194 |
| Mica Run 1 | mica_run1_image | 0,051 | 0,078 | 0,195 | 0,125 | 0,342 | 0,737 | 0,164 | 0,187 |
| Sabanci Okan Run 1 | Sabanci_Okan_run1_image | 0,053 | 0,106 | 0,189 | 0,143 | 0,111 | 0,216 | 0,12 | 0,153 |
| UAIC Run 1 | uaic2015_run1_image | 0,023 | 0,006 | 0,007 | 0,013 | 0,028 | 0,073 | 0,057 | 0,013 |
____________________________________________________________________________________________________________________
Contacts
Alexis Joly (INRIA-ZENITH): alexis(replace-that-by-a-dot)joly(replace-that-by-an-arrobe)inria.fr
Pierre Bonnet (AMAP): pierre(replace-that-by-a-dot)bonnet(replace-that-by-an-arrobe)cirad.fr
Hervé Goeau (INRIA-ZENITH, INRIA-IMEDIA)
| Attachment | Size |
|---|---|
| 8.49 KB | |
| 9.3 KB | |
| 10.52 KB | |
| 8.95 KB | |
| 401.11 KB | |
| 537.52 KB | |
| 156.61 KB | |
| 60.3 KB | |
| 6.74 KB | |
| 7.97 KB | |
| 272.41 KB | |
| 275.6 KB | |
| 117 KB | |
| 88.26 KB | |
| 91.27 KB | |
| 96.11 KB | |
| 92.58 KB | |
| 91.02 KB | |
| 99.12 KB | |
| 87.12 KB |