- ImageCLEF 2025
- LifeCLEF 2025
- ImageCLEF 2024
- LifeCLEF 2024
- ImageCLEF 2023
- LifeCLEF 2023
- ImageCLEF 2022
- LifeCLEF2022
- ImageCLEF 2021
- LifeCLEF 2021
- ImageCLEF 2020
- LifeCLEF 2020
- ImageCLEF 2019
- LifeCLEF 2019
- ImageCLEF 2018
- LifeCLEF 2018
- ImageCLEF 2017
- LifeCLEF2017
- ImageCLEF 2016
- LifeCLEF 2016
- ImageCLEF 2015
- LifeCLEF 2015
- ImageCLEF 2014
- LifeCLEF 2014
- ImageCLEF 2013
- ImageCLEF 2012
- ImageCLEF 2011
- ImageCLEF 2010
- ImageCLEF 2009
- ImageCLEF 2008
- ImageCLEF 2007
- ImageCLEF 2006
- ImageCLEF 2005
- ImageCLEF 2004
- ImageCLEF 2003
- Publications
- Old resources
You are here
LifeCLEF 2015 Fish task
Results publication
The LNCS lab overview paper summarizing the results of all LifeCLEF 2015 tasks is available here HERE (pdf). Individual working notes of the participants can be found within CLEF 2015 CEUR-WS proceedings.
Context
Underwater video and imaging systems are used increasingly in a range of monitoring or exploratory applications, in particular for biological (e.g. benthic community structure, habitat classification), fisheries (e.g. stock assessment, species richness), geological (e.g. seabed type, mineral deposits) and physical surveys (e.g. pipelines, cables, oil industry infrastructure). Their use has benefitted from the increasing miniaturisation and cost-effectiveness of submersible ROVs (remotely operated vehicles) and advances in underwater digital video. These technologies have revolutionised our ability to capture high-resolution images in challenging aquatic environments and are also greatly improving our ability to effectively manage natural resources, increasing our competitiveness and reducing operational risk in industries that operate in both marine and freshwater systems. Despite these advances in data collection technologies, the analysis of video data usually requires very time-consuming and expensive input by human observers. This is particularly true for ecological and fishery video data, which often require laborious visual analysis. This analytical "bottleneck" greatly restricts the use of these otherwise powerful video technologies and demands effective methods for automatic content analysis to enable proactive provision of analytical information.
Task Description
The dataset for the video-based fish identification task will be released in two times: the participants will first have access to the training set and a few months later, they will be provided with the testing set. The goal is to automatically count fish per species in video segments (e.g., video X contains N1 instances of fish of species 1, ..., Nn instances of fish species N).
Fish species
The 15 considered fish species for this task are:
Abudefduf Vaigiensis http://www.fishbase.us/summary/6630
Acanthurus Nigrofuscus http://fishbase.sinica.edu.tw/summary/4739
Amphiprion Clarkii http://www.fishbase.org/summary/5448
Chaetodon Speculum http://www.fishbase.org/summary/5576
Chaetodon Trifascialis http://www.fishbase.org/summary/5578
Chromis Chrysura http://www.fishbase.org/summary/Chromis-chrysura.html
Dascyllus Aruanus http://www.fishbase.org/summary/5110
Hemigymnus Melapterus http://www.fishbase.us/summary/5636
Myripristis Kuntee http://www.fishbase.org/summary/7306
Neoglyphidodon Nigroris http://www.fishbase.org/summary/5708
Plectrogly-Phidodon Dickii http://www.fishbase.org/summary/5709
Zebrasoma Scopas http://www.fishbase.org/summary/Zebrasoma-scopas.html
Training data
The training dataset consists of 20 videos manually annotated, a list of fish species (15) and for each species, a set of sample images to support the learning of fish appearance models.
Each video is manually labelled and agreed by two expert annotators and the ground truth consists of a set of bounding boxes (one for each instance of the given fish species list) together with the fish species. In total the training dataset contains more than 9000 annotations (bounding boxes + species) and more than 20000 sample images. However, it is not a statistical significant estimation of the test dataset rather its purpose is as a familiarization pack for designing the identification methods.
The dataset is unbalanced in the number of instances of fish species: for instance it contains 3165 instances of "Dascyllus Reticulates" and only 72 instances of "Zebrasoma Scopas". This was done not to favour nonparametric methods against model-based methods.
For each considered fish species, its fishbase.org link is also given. In the fishbase webpage, participants can find more detailed information about fish species including also high quality images. Please check the xls file provided in the training dataset archive.
In order to make the identification process independent from tracking, temporal information has not be exploited. This means that the annotators only labelled fish for which the species was clearly identifiable, i.e., if at frame t the species of fish A is not clear, it was not labelled, no matter if the same fish was in the previous frame (t-1).
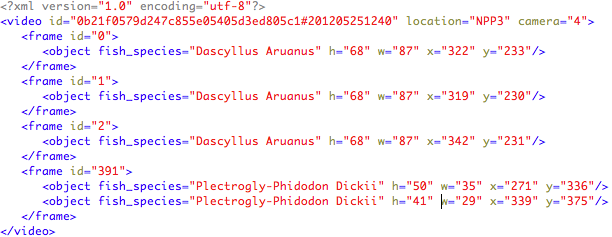
Each video is accompanied by an xml file (UTF-8 encoded) that contains instances of the provided list species. Each XML file is named with the same name of the corresponding labelled video, e.g., “0b21f0579d247c855e05405d3ed805c1#201205251240.xml”. For each video information on the location and the camera recording the video is also given.
The information is structured as follows:
Test data
The test set consists of 73 underwater videos. The list of considered fish species is shown above and was released with the training dataset. The number of occurrences per fish species in the ground truth is:

Please note that for three fish species there were no occurrences in the test set. Also in some video segments there were no fish.
This was done to test the methods' capability to reject false positives.
Run Format
The participants must provide a run file named as TeamName_runX.XML where X is the identifier of the run (up to three runs per participant). The run file must must contain all the videos included in the set and for each video the frame where fish have been detected together with the bounding box, contours (optional) and species name (only the most confident species) for each detected fish. The videos may also contain fish not belonging to one of the 15 considered species, and in that case the run XML file should report "Unknown" in the fish_species field.
Ax example of XML run file is here .
Metrics
As scoring functions, we computed:
- The counting score (CS) defined as
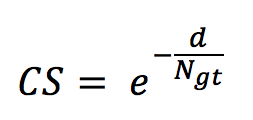
with d being the difference between the number of occurrences in the run (per species) and the number of occurrences in the ground truth N_gt. - The precision defined as

with TP and FP being, respectively, the true positives and the false positives. - The normalised counting score (NCS) defined as
NCS = CS x Pr
Results
The following charts show, respectively, the average (per video and species) normalized counting score, precision and counting score.

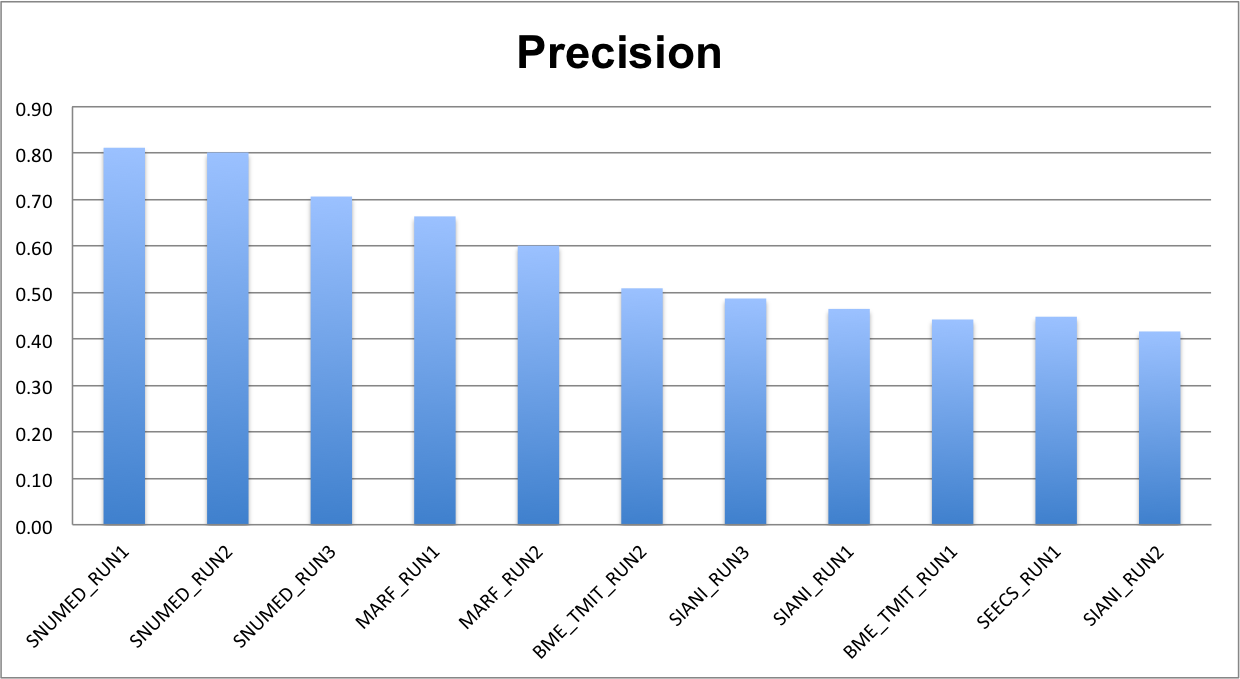

The detailed values are given in the following table.

The following figure and table show the normalized counting score per fish species.
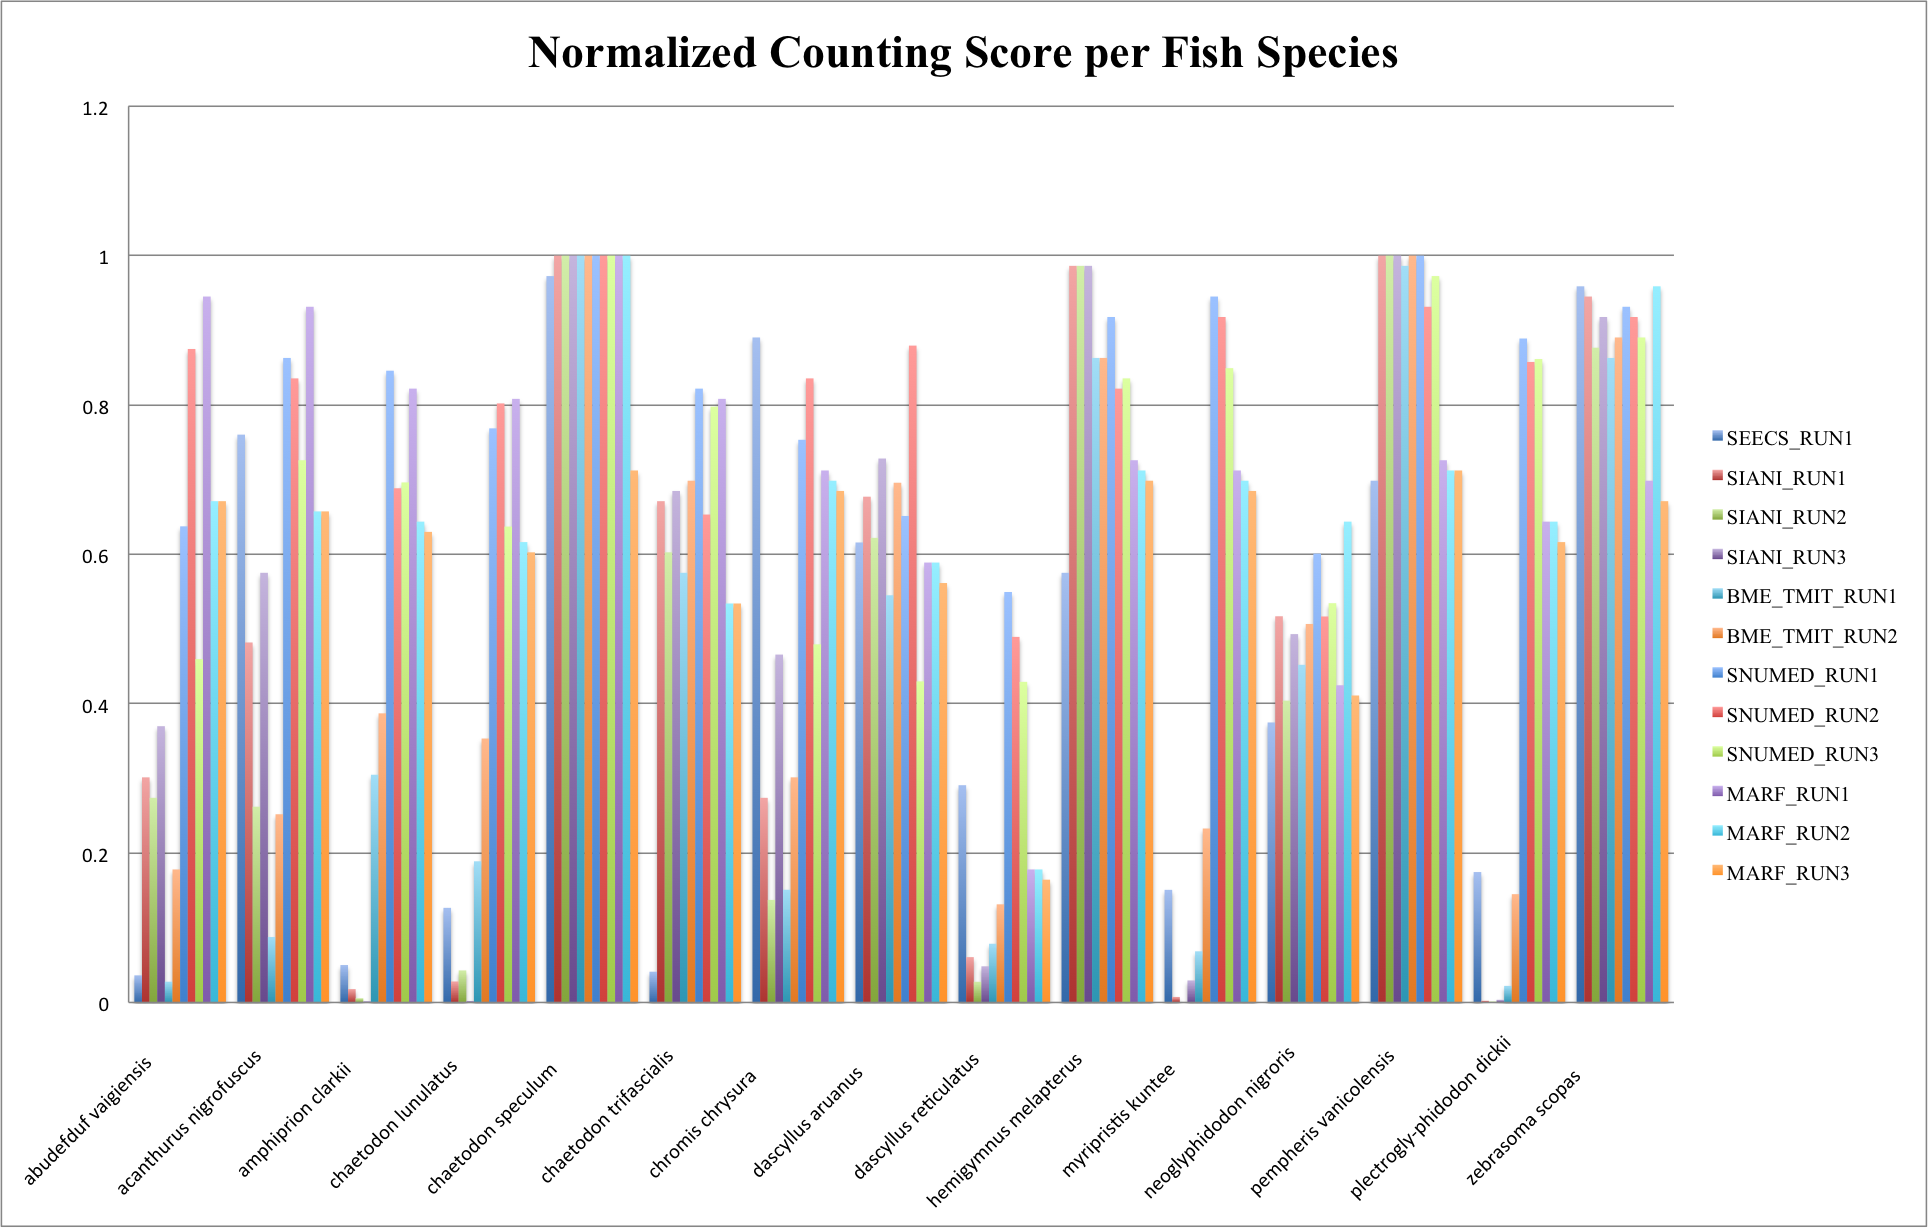
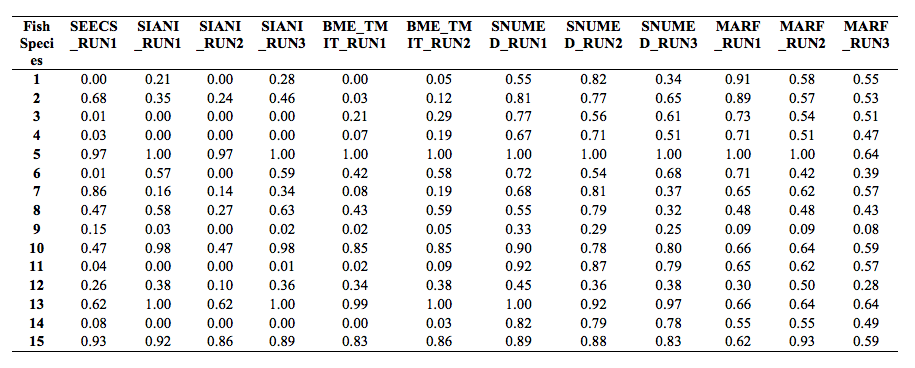
In cases, there were no occurrences of a given species (see fish species occurrences above) and in the runs no fish were observed of those species, CS = 1 (since d = 0) and we set Pr = 1. This explains why for some species the scores are much higher than for others.
Working notes
Submitting a working note with the full description of the methods used in each run is mandatory (deadline is May 31st). Any run that could not be reproduced thanks to its description in the working notes might be removed from the official publication of the results. Working notes are published within CEUR-WS proceedings, resulting in an assignment of an individual DOI (URN) and an indexing by many bibliography systems including DBLP. According to the CEUR-WS policies, a light review of the working notes will be conducted by LifeCLEF organizing committee to ensure quality.
How to register for the task
LifeCLEF will use the ImageCLEF registration interface. Here you can choose a user name and a password. This registration interface is for example used for the submission of runs. If you already have a login from the former ImageCLEF benchmarks you can migrate it to LifeCLEF 2014 here.
Contacts
Concetto Spampinato (University of Catania, Italy): cspampin[at]dieei[dot]unict[dot]it
Robert Bob Fisher (University of Edinburgh): rbf[at]inf[dot]ed[dot]ac[dot].uk
Simone Palazzo (University of Catania, Italy): simone.palazzo[at]dieei[dot]unict[dot]it
| Attachment | Size |
|---|---|
| 420.64 KB | |
| 58.54 KB | |
| 760 bytes | |
| 56.68 KB | |
| 11.61 KB | |
| 12.48 KB | |
| 166.38 KB | |
| 176.37 KB | |
| 183.67 KB | |
| 37.67 KB | |
| 742.37 KB | |
| 78.73 KB | |
| 753.2 KB |
