- ImageCLEF 2025
- LifeCLEF 2025
- ImageCLEF 2024
- LifeCLEF 2024
- ImageCLEF 2023
- LifeCLEF 2023
- ImageCLEF 2022
- LifeCLEF2022
- ImageCLEF 2021
- LifeCLEF 2021
- ImageCLEF 2020
- LifeCLEF 2020
- ImageCLEF 2019
- LifeCLEF 2019
- ImageCLEF 2018
- LifeCLEF 2018
- ImageCLEF 2017
- LifeCLEF2017
- ImageCLEF 2016
- LifeCLEF 2016
- ImageCLEF 2015
- LifeCLEF 2015
- ImageCLEF 2014
- LifeCLEF 2014
- ImageCLEF 2013
- ImageCLEF 2012
- ImageCLEF 2011
- ImageCLEF 2010
- ImageCLEF 2009
- ImageCLEF 2008
- ImageCLEF 2007
- ImageCLEF 2006
- ImageCLEF 2005
- ImageCLEF 2004
- ImageCLEF 2003
- Publications
- Old resources
You are here
SeaCLEF 2016

News
The training and test datasets for coral fish species recognition task have been released on Feb, 1st.
Usage scenario
The SeaCLEF 2016 task originates from the previous editions (2014 and 2015) of the fish identification task, i.e. video-based coral fish species identification for ecological surveillance and biodiversity monitoring. SeaCLEF 2016 will extend FishCLEF 2014 and 2015 in that we do not only consider fish species, but sea organisms in general, from fish to whales to dolphins to sea beds to corals. The need of automated methods for sea-related visual data and to extend the originary tasks is driven by the advances in imaging systems (both underwater and not) and their employment for marine ecosystem analysis and biodiversity monitoring. Indeed in recent years we have assisted an exponential growth of sea-related visual data, in the forms of images and videos, for disparate reasoning ranging from fish biodiversity monitoring to marine resource managements to fishery to educational purposes. However, the analysis of such data is particularly expensive for human operators, thus limiting greatly the impact that the technology may have in understanding and sustainably exploiting the sea.
Data collection
The SeaCLEF 2016 visual data dataset will contain both videos and images of marine organisms. In all cases, the goal is to identify species or individuals from visual data either images or videos. Additional metadata gathered from social website will be provided to support the classification tasks. Examples of the data that will be released are: a) underwater videos for coral fish species recognition or from the b) coral and marine animal images (possibly including aerial images from Cetamada for whale individual recognition) for species recognition.
However, the number of marine objects, to be considered for the task, is not limited to coral fish and whales but will be incremental and will be defined just before the the training set release. We will add as many marine species objects as possible based on further agreements until the date of data release. All the visual data will be provided with additional metadata describing water depth, GPS coordinates, etc. as well as user social annotations.
Tasks description
Task1: Coral Reef Species Recognition
The participants will first have access to the training set and a few months later, they will be provided with the testing set. The goal of the task will be to automatically identify and recognize coral reef species. Participants will be allowed to use any of the provided metadata as well as specific fish taxonomies that might help in the species identification process. The 15 considered fish species for this task are:
Abudefduf Vaigiensis http://www.fishbase.us/summary/6630
Acanthurus Nigrofuscus http://fishbase.sinica.edu.tw/summary/4739
Amphiprion Clarkii http://www.fishbase.org/summary/5448
Chaetodon Speculum http://www.fishbase.org/summary/5576
Chaetodon Trifascialis http://www.fishbase.org/summary/5578
Chromis Chrysura http://www.fishbase.org/summary/Chromis-chrysura.html
Dascyllus Aruanus http://www.fishbase.org/summary/5110
Hemigymnus Melapterus http://www.fishbase.us/summary/5636
Myripristis Kuntee http://www.fishbase.org/summary/7306
Neoglyphidodon Nigroris http://www.fishbase.org/summary/5708
Plectrogly-Phidodon Dickii http://www.fishbase.org/summary/5709
Zebrasoma Scopas http://www.fishbase.org/summary/Zebrasoma-scopas.html
Training and test datasets
The training dataset consists of 20 videos manually annotated, a list of fish species (15) and for each species, a set of sample images to support the learning of fish appearance models. Each video is manually labelled and agreed by two expert annotators and the ground truth consists of a set of bounding boxes (one for each instance of the given fish species list) together with the fish species. In total the training dataset contains more than 9000 annotations (bounding boxes + species) and more than 20000 sample images. However, it is not a statistical significant estimation of the test dataset rather its purpose is as a familiarization pack for designing the identification methods.
The dataset is unbalanced in the number of instances of fish species: for instance it contains 3165 instances of "Dascyllus Reticulates" and only 72 instances of "Zebrasoma Scopas". This was done not to favour nonparametric methods against model-based methods.
For each considered fish species, its fishbase.org link is also given. In the fishbase webpage, participants can find more detailed information about fish species including also high quality images. Please check the xls file provided in the training dataset archive.
In order to make the identification process independent from tracking, temporal information has not be exploited. This means that the annotators only labelled fish for which the species was clearly identifiable, i.e., if at frame t the species of fish A is not clear, it was not labelled, no matter if the same fish was in the previous frame (t-1).
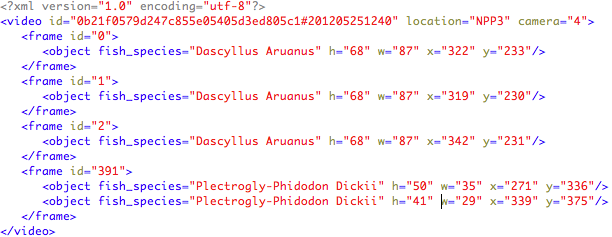
Each video is accompanied by an xml file (UTF-8 encoded) that contains instances of the provided list species. Each XML file is named with the same name of the corresponding labelled video, e.g., “0b21f0579d247c855e05405d3ed805c1#201205251240.xml”. For each video information on the location and the camera recording the video is also given.
The information is structured as follows:
The test dataset consists of 73 underwater videos. The list of considered fish species is shown above and was released with the training dataset. The number of occurrences per fish species in the ground truth is:

Please note that for three fish species there were no occurrences in the test set. Also in some video segments there were no fish. This was done to test the methods' capability to reject false positives.
Run Format
The participants must provide a run file named as TeamName_runX.XML where X is the identifier of the run (up to three runs per participant). The run file must must contain all the videos included in the set and for each video the frame where fish have been detected together with the bounding box, contours (optional) and species name (only the most confident species) for each detected fish. The videos may also contain fish not belonging to one of the 15 considered species, and in that case the run XML file should report "Unknown" in the fish_species field.
Ax example of XML run file is here .
Metrics
As scoring functions, we computed:
- The counting score (CS) defined as
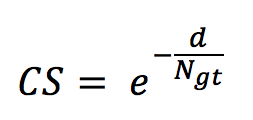
with d being the difference between the number of occurrences in the run (per species) and the number of occurrences in the ground truth N_gt. - The precision defined as

with TP and FP being, respectively, the true positives and the false positives. - The normalised counting score (NCS) defined as
NCS = CS x Pr
Results
The following charts show, respectively, the average (per video and species) normalized counting score, precision and counting score obtained by hte two participant teams (CVG_Jena_Fulda and BMETMIT) that submitted only one run. Beside the results achieved by the 2016 participants, the graph also shows the best performance achieved on the same dataset in 2015 competion.
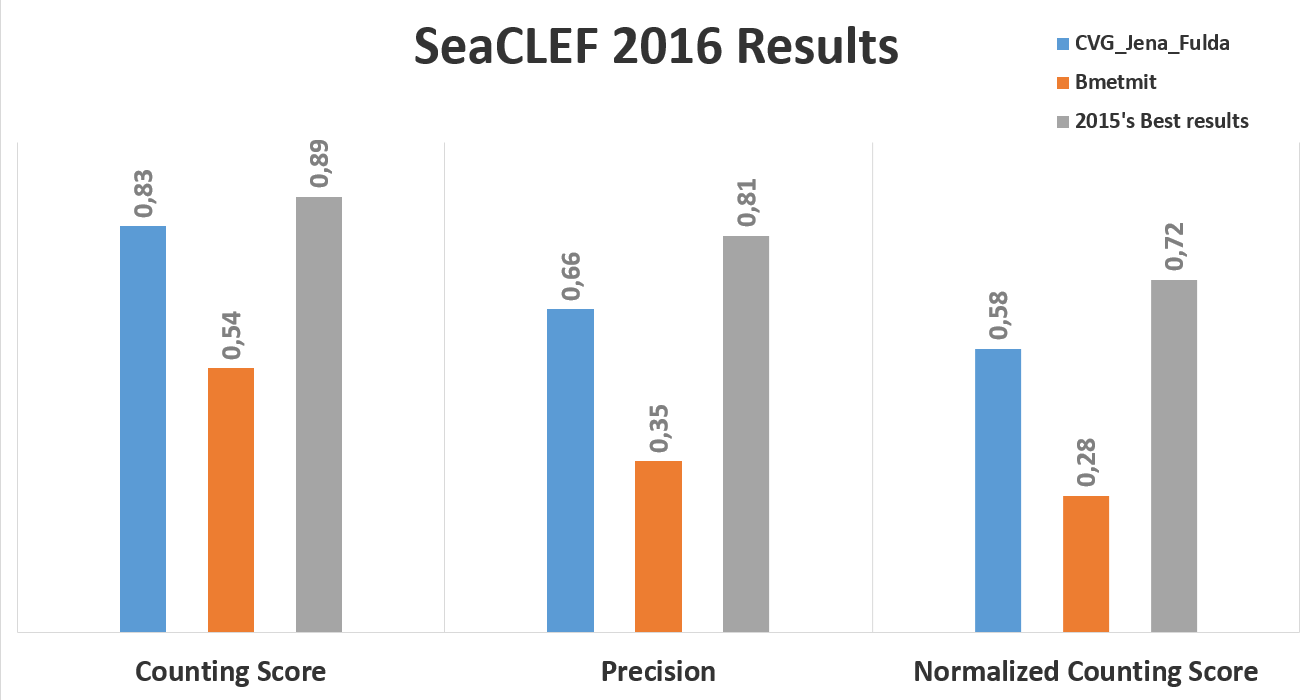
The following figure, instead, shows the normalized counting score per fish species.

The detailed values are available at this link.
Task2: Whale Individual Recognition
Dataset
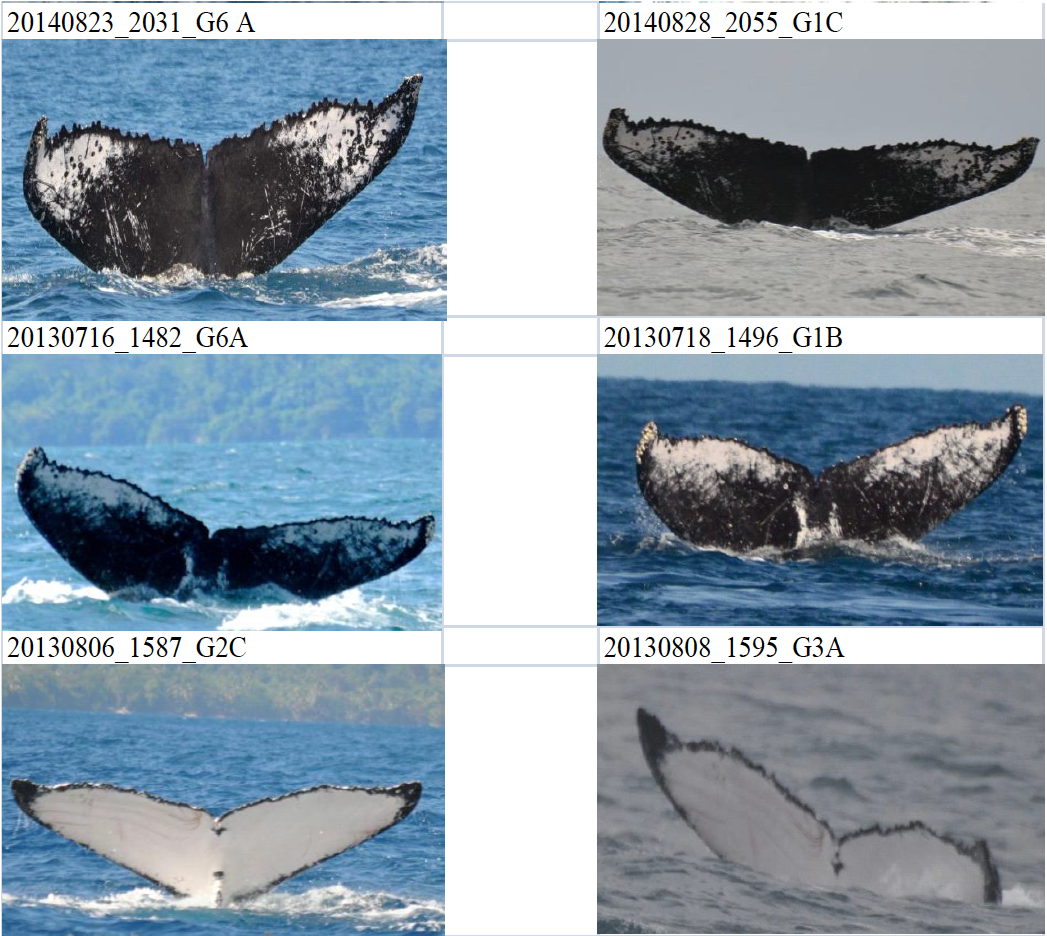
The dataset consists of 2005 images of whales caudals such as the one of Figure 1 (each line correspond to two images of the same individual). The images were acquired between 2009 and 2014 by members of the Cetamada NGO in the area of the Sainte-Marie island near Madagascar. Each image was manually cropped so as to focus only on the caudal fin that is most discriminant pattern for distinguishing an individual whale from another. Finding the images that correspond to the same individual whale is a crucial step for further biological analysis (e.g. for monitoring population displacement). Matching the images manually is however a painful and definitely unscalable process. Thus, it is required to automatize this process. More concretely, the goal of the task is to discover as much as possible image pairs corresponding to the same individual whale (such as the 3 matches of Figure 1).
Run Format
The participants must provide a run file (i.e. a raw text file) named as "TeamName_whalerun_X.txt" where X is the identifier of the run (up to three runs per participant). The run file must contain as much lines as the number of discovered matches, each match being a triplet of the form:
<imageX.jpg imageY.jpg score>
where score is a confidence score between 0 and 1 (1 for highly confident matches). The matches have to be sorted by decreasing confidence score. A run should not contain any duplicate match (e.g. [imageX.jpg imageY.jpg score1] and [imageY.jpg imageX.jpg score2] should not appear in the same run file). Here is a short fake run example respecting this format and containing only 6 fake matches:
SEACLEForgs_whalerun_2.txt
Metrics
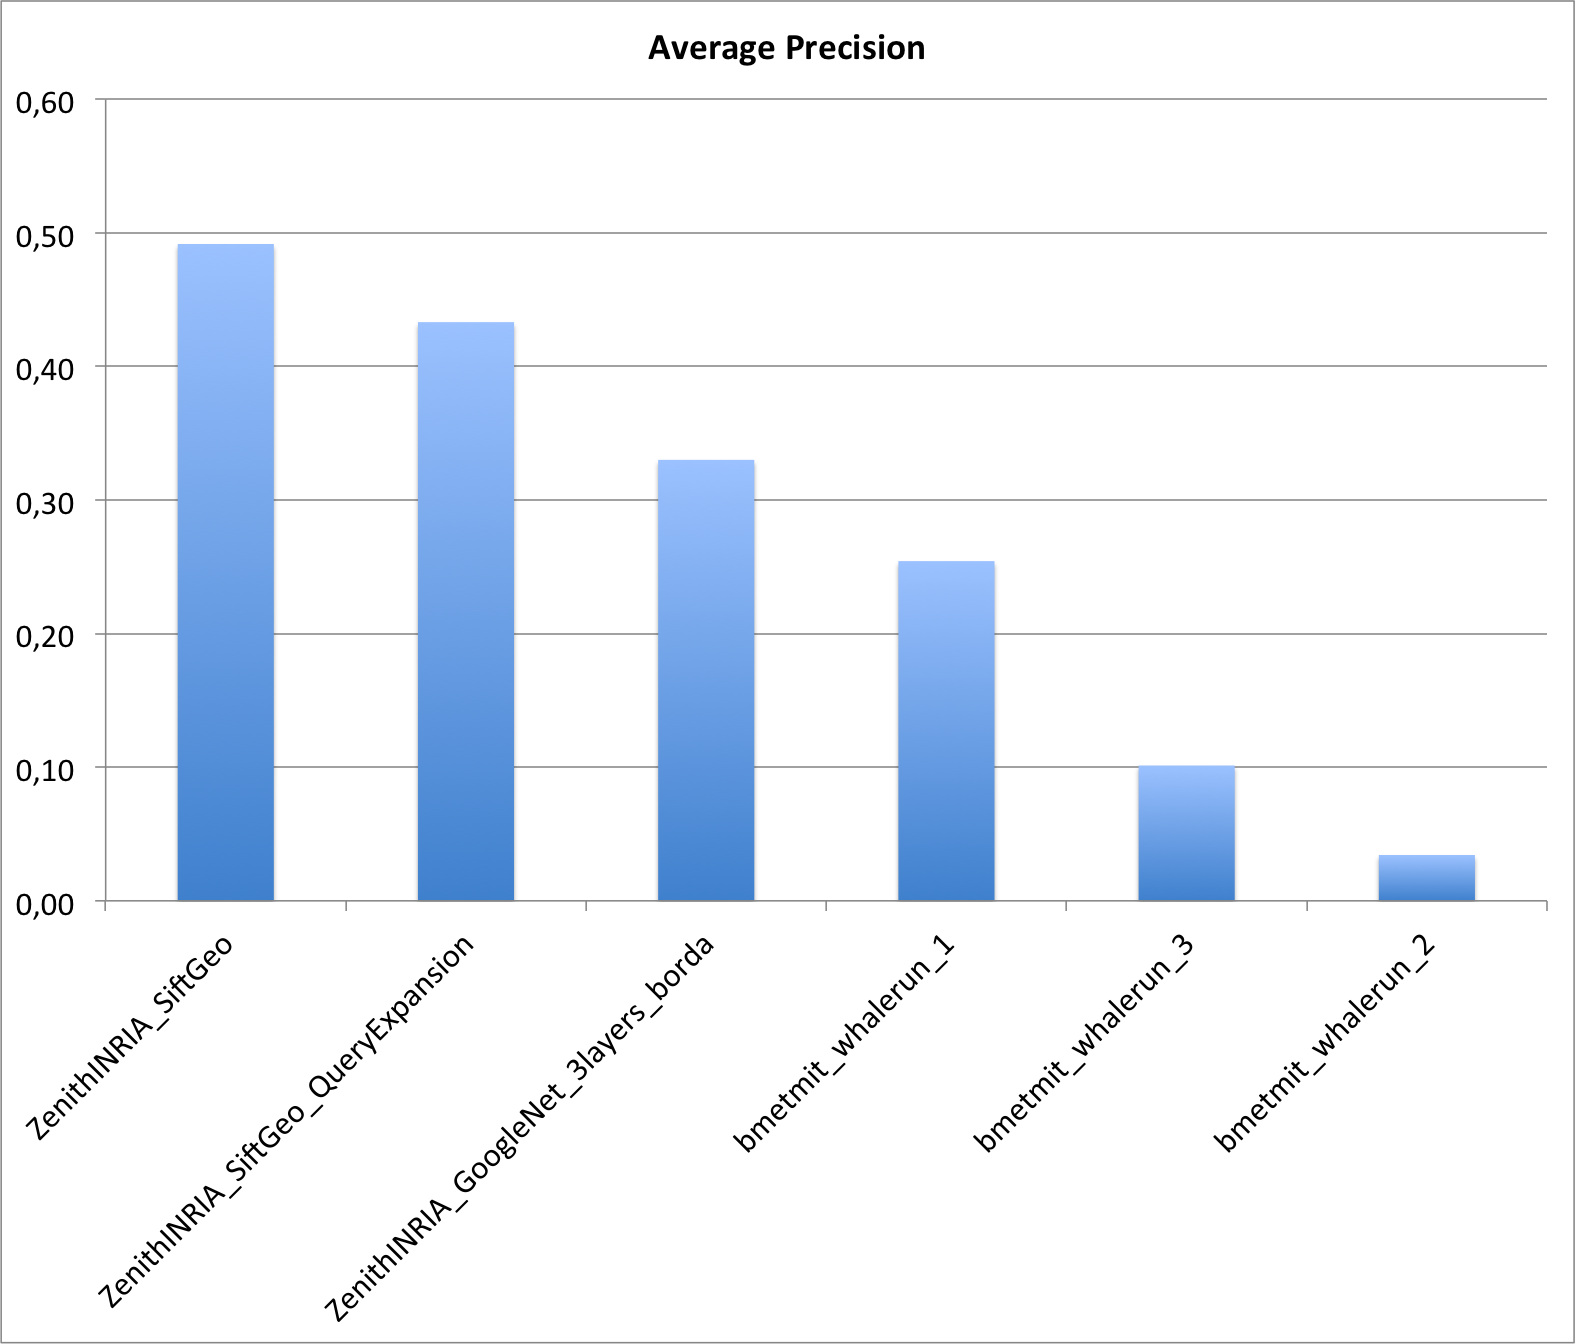
The metric used to evaluate each run will be the Average Precision (i.e. the precision averaged across all good matches of the groundtruth).
Results
Two research groups submitted a total of 6 runs. The following graphic and table provides the Average Precision of the 6 runs. Details of the used methods can be found in the working note of the subtask (to be published soon).

| Attachment | Size |
|---|---|
| 78.87 KB | |
| 55.5 KB | |
| 30.75 KB | |
| 273.4 KB | |
| 41.39 KB |
